UNITED STATES
SECURITIES AND EXCHANGE COMMISSION
Washington, D.C. 20549
FORM 8-K
CURRENT REPORT
Pursuant to Section 13 or 15(d) of
the Securities Exchange Act of 1934
Date of Report (Date of earliest event reported): October 27, 2020
South Plains Financial, Inc.
(Exact name of registrant as specified in its charter)
|
Texas
|
001-38895
|
75-2453320
|
|
(State or other jurisdiction of incorporation)
|
(Commission File Number)
|
(IRS Employer Identification No.)
|
|
5219 City Bank Parkway
Lubbock, Texas
|
79407
|
|
|
(Address of principal executive offices)
|
(Zip Code)
|
(806) 792-7101
(Registrant’s telephone number, including area code)
Check the appropriate box below if the Form 8-K filing is intended to simultaneously satisfy the filing obligation of the registrant under any of the following provisions:
| ☐ |
Written communications pursuant to Rule 425 under the Securities Act (17 CFR 230.425)
|
| ☐ |
Soliciting material pursuant to Rule 14a-12 under the Exchange Act (17 CFR 240.14a-12)
|
| ☐ |
Pre-commencement communications pursuant to Rule 14d-2(b) under the Exchange Act (17 CFR 240.14d-2(b))
|
| ☐ |
Pre-commencement communications pursuant to Rule 13e-4(c) under the Exchange Act (17 CFR 240.13e-4(c))
|
Securities registered pursuant to Section 12(b) of the Act:
|
Title of each class
|
Trading Symbol(s)
|
Name of each exchange on which registered
|
|
Common Stock, par value $1.00 per share
|
SPFI
|
The Nasdaq Stock Market LLC
|
Indicate by check mark whether the registrant is an emerging growth company as defined in Rule 405 of the Securities Act of 1933 (§230.405 of this chapter) or Rule 12b-2 of the Securities Exchange Act of 1934 (§240.12b-2 of this chapter).
Emerging growth company ☒
If an emerging growth company, indicate by check mark if the registrant has elected not to use the extended transition period for complying with any new or revised financial accounting standards provided pursuant to Section
13(a) of the Exchange Act. ☐
| Item 2.02 |
Results of Operations and Financial Condition.
|
On October 27, 2020, South Plains Financial, Inc. (the “Company”) issued a press
release announcing its financial results for the third quarter ended September 30, 2020. A copy of the Company’s press release covering such announcement and certain other matters is furnished as Exhibit 99.1 to this Current Report on Form 8-K.
| Item 7.01 |
Regulation FD Disclosure.
|
On October 27, 2020, officers of the Company will have a conference call with respect to the Company’s financial results for the third quarter ended September 30, 2020. An earnings release slide
presentation highlighting the Company’s financial results for the third quarter ended September 30, 2020 is furnished as Exhibit 99.2 to this Current Report on Form 8-K. This earnings release slide presentation will also be available on the
Company’s website, www.spfi.bank, under the “News & Events” section.
In accordance with General Instruction B.2 of Form 8-K, the information in Item 2.02 and 7.01 of this Current Report on Form 8-K, including Exhibit 99.1 and Exhibit 99.2 hereto, shall not be deemed
“filed” for the purposes of Section 18 of the Securities Exchange Act of 1934, as amended, or otherwise subject to the liabilities of that section. The information in Item 2.02 and 7.01 of this Current Report on Form 8-K, including Exhibit 99.1
and Exhibit 99.2 hereto, shall not be incorporated by reference into any filing or other document pursuant to the Securities Act of 1933, as amended, except as shall be expressly set forth by specific reference in such filing or document.
| Item 9.01 |
Financial Statements and Exhibits.
|
| (d) |
Exhibits.
|
| 99.1 |
Press release, dated October 27, 2020, announcing third quarter 2020 financial results of South Plains Financial, Inc.
|
| 99.2 |
Earnings release slide presentation, dated October 27, 2020
|
SIGNATURES
Pursuant to the requirements of the Securities Exchange Act of 1934, the registrant has duly caused this report to be signed on its behalf by the undersigned hereunto duly authorized.
|
SOUTH PLAINS FINANCIAL, INC.
|
||
|
Dated: October 27, 2020
|
By:
|
/s/ Curtis C. Griffith
|
|
Curtis C. Griffith
|
||
|
Chairman and Chief Executive Officer
|
||
Exhibit 99.1

South Plains Financial, Inc. Reports Third Quarter 2020 Financial Results
LUBBOCK, Texas, October 27, 2020 (GLOBE NEWSWIRE) – South Plains Financial, Inc. (NASDAQ:SPFI) (“South Plains” or the “Company”), the parent company of City Bank (“City Bank” or the “Bank”), today
reported its financial results for the quarter ended September 30, 2020.
Third Quarter 2020 Highlights
| ● |
Net income for the third quarter of 2020 was $16.7 million, compared to $5.6 million for the second quarter of 2020 and $8.3 million for the third quarter of 2019.
|
| ● |
Diluted earnings per share for the third quarter of 2020 was $0.92, compared to $0.31 for the second quarter of 2020 and $0.45 for the third quarter of 2019.
|
| ● |
Pre-tax, pre-provision income (non-GAAP) for the third quarter of 2020 was $26.9 million, compared to $20.1 million for the second quarter of 2020 and $10.7 million for the third quarter of 2019.
|
| ● |
Average cost of deposits for the third quarter of 2020 decreased to 34 basis points, compared to 39 basis points for the second quarter of 2020 and 98 basis points for the third quarter of 2019.
|
| ● |
The provision for loan losses for the third quarter of 2020 was $6.1 million, compared to $13.1 million for the second quarter of 2020 and $420,000 for the third quarter of 2019.
|
| ● |
Nonperforming assets to total assets were 0.46% at September 30, 2020, compared to 0.33% at June 30, 2020 and 0.31% at September 30, 2019.
|
| ● |
The adjusted (non-GAAP) efficiency ratio for the third quarter of 2020 was 56.90%, compared to 63.28% for the second quarter of 2020 and 73.62% for the third quarter of 2019.
|
| ● |
Return on average assets for the third quarter of 2020 was 1.88% annualized, compared to 0.64% annualized for the second quarter of 2020 and 1.18% annualized for the third quarter of 2019.
|
| ● |
Book value per share was $19.52 as of September 30, 2020, compared to $18.64 per share as of June 30, 2020 and $16.61 per share as of September 30, 2019.
|
| ● |
On September 29, 2020, the Company completed an issuance of $50 million of subordinated notes.
|
Curtis Griffith, South Plains’ Chairman and Chief Executive Officer, commented, “I am very pleased with our performance as the Bank’s operations continue to run smoothly and our
customers have largely weathered the uncertain economic environment to date. Our decision to allow our borrowers to modify their loans to interest only payments early in the pandemic has proven to be a sound one as this allowed our customers to build
cash and better manage their businesses. Importantly, we have experienced a sharp decline in active modifications related to COVID-19 during the third quarter, with only 5.4% of our portfolio remaining in an active modification versus 19.9% of the
portfolio at June 30, 2020. While we are optimistic that our local economies are improving with the pace of business accelerating, we continue to manage our loan portfolio and reserves conservatively having recorded a $6.1 million provision for loan
loss in the third quarter of 2020, which was largely qualitative, and compares favorably to the $13.1 million provision in the second quarter of 2020. At quarter end, our allowance for loan loss was 2.01%.”
Mr. Griffith continued, “We also experienced strong revenue growth in the quarter as the investments that we have made in our mortgage business are generating strong results. Over
the last year, we have actively recruited seasoned mortgage teams that have been instrumental in driving market share gains in the builder and purchase markets. We have also maintained our expense structure in this business as volumes have grown
which has contributed to strong margin gains and insulates us against the eventual decline in refinance volumes. Turning to capital, we opportunistically issued $50 million of fixed-to-floating rate subordinated notes, that qualify as Tier 2 capital
for regulatory purposes, in the quarter at an attractive interest rate which will position the Company to take advantage of any dislocations that may occur in the market while providing protection if the pandemic were to severely worsen, which is not
our expectation. We continue to be pleased with our acquisition of West Texas State Bank this past year and see M&A as an attractive strategy to further expand our geographic footprint in West Texas.”
Results of Operations, Quarter Ended September 30, 2020
Net Interest Income
Net interest income was $31.3 million for the third quarter of 2020, compared to $26.6 million for the third quarter of 2019 and $30.4 million for the second quarter of 2020.
Interest income was $34.5 million for the third quarter of 2020, compared to $33.7 million for the third quarter of 2019 and $34.0 million for the second quarter of 2020. Interest and fees on loans increased by $1.1
million from the third quarter of 2019 due to growth of $414.3 million in average loans, primarily from the Company’s acquisition of West Texas State Bank (“WTSB”) as well as the Small Business Administration (“SBA”) Paycheck Protection Program
(“PPP”) loans that were originated largely in the second quarter of 2020, partially offset by a decrease of 63 basis points in non-PPP loan rates due to the decline in the interest rate environment experienced in the first quarter of 2020. Interest
income increased slightly in the third quarter of 2020 from the second quarter of 2020 due to the additional interest and fees on PPP loans. The PPP loans yielded 3.00% during the third quarter of 2020, which includes accretion of the related SBA
lender fees for processing PPP loans during the quarter. As of September 30, 2020, the Company has originated approximately 2,100 PPP loans, totaling $218 million, and has received $7.8 million in PPP related SBA fees. These fees are deferred and
then accreted into interest income over the life of the applicable loans. During the third quarter of 2020, the Company recognized $1.1 million in PPP related SBA fees. The Company expects that the majority of PPP loans will be forgiven over the
next several quarters. At September 30, 2020, there is $6.1 million of deferred fees that have not been accreted to income.
Interest expense was $3.2 million for the third quarter of 2020, compared to $7.1 million for the third quarter of 2019 and $3.6 million for the second quarter of 2020. The decrease from the third
quarter of 2019 was primarily due to a decrease in the interest rate paid on interest-bearing liabilities of 91 basis points, partially offset by an increase of $303.4 million in average interest-bearing liabilities. The increase in average
interest-bearing liabilities was largely due to the Company’s acquisition of WTSB as well as growth in deposits from PPP loan funding and other government stimulus payments and programs as well as organic growth. Additionally, the decrease in the
rate paid on interest-bearing liabilities was the result of the decline in the overall rate environment experienced in the first quarter of 2020. The decrease in interest expense from the second quarter of 2020 was primarily due to a decrease in the
interest rate paid on interest-bearing liabilities of 6 basis points and by a decrease of $28.3 million in average interest-bearing liabilities in the third quarter of 2020. The average cost of deposits was 34 basis points for the third quarter of
2020, representing a 64 basis point decrease from the third quarter of 2019 and a 5 basis point decrease from the second quarter of 2020. The decrease in average interest-bearing liabilities was primarily due to paying back $95.0 million in advances
from the Federal Home Loan Bank of Dallas (“FHLB”), partially offset by organic growth of $41.3 million in average interest-bearing deposits.
The net interest margin was 3.82% for the third quarter of 2020, compared to 4.07% for the third quarter of 2019 and 3.79% for the second quarter of 2020.
Noninterest Income and Noninterest Expense
Noninterest income was $31.7 million for the third quarter of 2020, compared to $14.1 million for the third quarter of 2019 and $24.9 million for the second quarter of 2020. The increase in noninterest
income for the third quarter of 2020 compared to the third quarter of 2019 was primarily due to growth of $14.4 million in mortgage banking activities revenue as a result of an additional $209.6 million in mortgage loan originations. Additionally,
there was an increase in income from insurance activities of $2.2 million in the third quarter of 2020 related to recent acquisitions as well as the effect of adoption of the revenue recognition standard for quarterly reporting in 2020, which has
delayed the recognition of revenue until later in the year as compared to previous years. The increase from the second quarter of 2020 was primarily due to growth of $3.5 million in mortgage banking activities revenue as a result of an additional
$31.8 million in mortgage loan originations and an increase of $2.3 million in income from insurance activities.
Noninterest expense was $36.0 million for the third quarter of 2020, compared to $30.0 million for the third quarter of 2019 and $35.2 million for the second quarter of 2020. This increase in
noninterest expense for the third quarter of 2020 compared to the third quarter of 2019 was primarily driven by a $5.5 million increase in personnel expense. This increase was predominately related to an additional $3.0 million in commissions paid on
the higher volume of mortgage loan originations and personnel in the Bank’s branches in the Permian Basin that were acquired in the fourth quarter of 2019 through the Company’s acquisition of WTSB. The remaining other noninterest expenses increased
$428,000, or 3.6%, which encompasses the additional variable mortgage expenses related to the growth in mortgage production and other operating expenses and core deposit intangible amortization from the acquisition of WTSB. The increase from the
second quarter of 2020 was primarily the result of an additional $758,000 in commissions and higher other variable expenses as a result of increased mortgage production and insurance activities. This increase was partially offset by a recovery of
$303,000 of legal expenses from the previously disclosed settlement of a lawsuit in September 2020 as well as other expense reductions.
Loan Portfolio and Composition
Loans held for investment were $2.29 billion as of September 30, 2020, compared to $2.33 billion as of June 30, 2020 and $1.96 billion as of September 30, 2019. The $43.5 million decrease during the
third quarter of 2020 as compared to the second quarter of 2020 was primarily the result of paydowns of $10.1 million in non-residential consumer loans and $8.0 million in direct energy loans as well as several large commercial real estate loans that
paid off early. As of September 30, 2020, loans held for investment increased $325.6 million from September 30, 2019, largely attributable to the PPP loans primarily funded in the second quarter of 2020 and the WTSB acquisition in the fourth quarter
of 2019.
Agricultural production loans were $133.9 million as of September 30, 2020, compared to $131.5 million as of June 30, 2020 and $166.8 million as of September 30, 2019. The Company did not experience the
typical historical increase in seasonal fundings on these agricultural production loans during the third quarter of 2020, primarily as a result of drought conditions or damaged crops and where the borrower received crop insurance proceeds to pay down
the loans.
Deposits and Borrowings
Deposits totaled $2.94 billion as of September 30, 2020, compared to $2.95 billion as of June 30, 2020 and $2.29 billion as of September 30, 2019. Deposits decreased $4.0 million in the third quarter of
2020 from June 30, 2020. As of September 30, 2020, deposits increased $657.8 million from September 30, 2019. The increase in deposits since September 30, 2019 is primarily a result of organic growth as well as the assumption of deposits from the
WTSB acquisition in the fourth quarter of 2019.
Noninterest-bearing deposits were $906.1 million as of September 30, 2020, compared to $940.9 million as of June 30, 2020 and $556.2 million as of September 30, 2019. Noninterest-bearing deposits
represented 30.8%, 31.9%, and 24.3% of total deposits as of September 30, 2020, June 30, 2020, and September 30, 2019, respectively. The decrease in noninterest-bearing deposit balances at September 30, 2020 compared to June 30, 2020 was largely the
result of customer quarterly estimated tax payments that were extended until July 15, 2020.
The Bank has utilized its lines of credit with FHLB and the Federal Reserve Bank of Dallas to supplement funding for origination of PPP loans as needed. This included borrowing $75.0 million from FHLB
for a three month term. This borrowing matured in July 2020 and was repaid in full.
On September 29, the Company issued $50.0 million in 10 year fixed-to-floating rate subordinated notes on September 29, 2020. These notes bear interest at a fixed rate of 4.50% for the first five years,
and the interest rate will reset quarterly thereafter to the then current three-month Secured Overnight Financing Rate, as published by the Federal Reserve Bank of New York, plus 438 basis points.
Asset Quality
As part of the Bank’s efforts to support its customers and protect the Bank as a result of the COVID-19 pandemic, the Bank has offered varying forms of loan modifications including 90-day payment
deferrals, 6-month interest only terms, or in certain select cases periods of longer than 6 months of interest only, to provide borrowers relief. As of September 30, 2020, total active loan modifications attributed to COVID-19 were $124.0 million, or
5.4% of the Company’s loan portfolio, down from $464.4 million, or 19.9% of the Company’s loan portfolio, at June 30, 2020. The modified loan breakdown as of September 30, 2020 is: 36% are 6 months interest only, 7% are 90 day payment deferrals on
commercial customers, 57% are interest only periods longer than 6 months, primarily in the hotel portfolio, and less than 1% are payment deferrals of one to four months on consumer loans.
The provision for loan losses recorded for the third quarter of 2020 was $6.1 million, compared to $420,000 for the third quarter of 2019 and $13.1 million for the second quarter of 2020. The increase
in the provision for loan losses in the third quarter of 2020 compared to the third quarter of 2019 is a result of economic effects from COVID-19, the decline in the oil and gas industry, and the change in credit quality and increase in nonperforming
assets. The decrease from the second quarter of 2020 is a result of a modest improvement in the economy as well as a decline in the amount of loans that are actively under a modification. There is continued uncertainty from COVID-19 and the full
extent of the impact on the economy and the Bank’s customers is unknown at this time. Accordingly, additional provisions for loan losses may be necessary in future periods.
The allowance for loan losses to loans held for investment was 2.01% as of September 30, 2020, compared to 1.74% as of June 30, 2020 and 1.23% as of September 30, 2019. The allowance for loan losses to
non-PPP loans held for investment was 2.22% as of September 30, 2020.
The nonperforming assets to total assets ratio as of September 30, 2020 was 0.46%, compared to 0.33% as of June 30, 2020 and 0.31% at September 30, 2019. The increase in the third quarter of 2020
related to a $5.4 million relationship in the transportation industry that was put on nonaccrual. The loans have performed as agreed but were placed on nonaccrual status due to stress in the borrower’s industry. The borrower paid off $2.1 million of
this debt in October 2020.
Annualized net charge-offs were 0.10 % for the third quarter of 2020, compared to 0.27% for the second quarter of 2020 and 0.08% for the third quarter of 2019.
Conference Call
South Plains will host a conference call to discuss its third quarter 2020 financial results today, October 27, 2020 at 5:00 p.m., Eastern Time. Investors and analysts interested in participating in the
call are invited to dial 1-877-407-9716 (international callers please dial 1-201-493-6779) approximately 10 minutes prior to the start of the call. A live audio webcast of the conference call and conference materials will be available on the
Company’s website at https://www.spfi.bank/news-events/events.
A replay of the conference call will be available within two hours of the conclusion of the call and can be accessed on the investor section of the Company’s website as well as by dialing 1-844-512-2921
(international callers please dial 1-412-317-6671). The pin to access the telephone replay is 13711893. The replay will be available until November 10, 2020.
About South Plains Financial, Inc.
South Plains is the bank holding company for City Bank, a Texas state-chartered bank headquartered in Lubbock, Texas. City Bank is one of the largest independent banks in West Texas and has additional banking operations in
the Dallas, El Paso, Greater Houston, the Permian Basin, and College Station Texas markets, and the Ruidoso and Eastern New Mexico markets. South Plains provides a wide range of commercial and consumer financial services to small and medium-sized
businesses and individuals in its market areas. Its principal business activities include commercial and retail banking, along with insurance, investment, trust and mortgage services. Please visit https://www.spfi.bank for more information.
Non-GAAP Financial Measures
Some of the financial measures included in this press release are not measures of financial performance recognized in accordance with generally accepted accounting principles in the United States
(“GAAP”). These non-GAAP financial measures include Tangible Book Value Per Common Share, Tangible Common Equity to Tangible Assets, Adjusted Efficiency Ratio, and Pre-Tax, Pre-Provision Income. The Company believes these non-GAAP financial measures
provide both management and investors a more complete understanding of the Company’s financial position and performance. These non-GAAP financial measures are supplemental and are not a substitute for any analysis based on GAAP financial measures.
We classify a financial measure as being a non-GAAP financial measure if that financial measure excludes or includes amounts, or is subject to adjustments that have the effect of excluding or including
amounts, that are included or excluded, as the case may be, in the most directly comparable measure calculated and presented in accordance with GAAP as in effect from time to time in the United States in our statements of income, balance sheets or
statements of cash flows. Not all companies use the same calculation of these measures; therefore, this presentation may not be comparable to other similarly titled measures as presented by other companies.
A reconciliation of non-GAAP financial measures to GAAP financial measures is provided at the end of this press release.
Available Information
The Company routinely posts important information for investors on its web site (under www.spfi.bank and, more specifically, under the News & Events
tab at www.spfi.bank/news-events/press-releases). The Company intends to use its web site as a means of disclosing material non-public information and for complying with its disclosure obligations under Regulation FD (Fair Disclosure)
promulgated by the U.S. Securities and Exchange Commission (the “SEC”). Accordingly, investors should monitor the Company’s web site, in addition to following the Company’s press releases, SEC filings, public conference calls, presentations and
webcasts.
The information contained on, or that may be accessed through, the Company’s web site is not incorporated by reference into, and is not a part of, this document.
Forward Looking Statements
This press release contains forward-looking statements within the meaning of the Private Securities Lititgation Reform Act of 1995. These forward-looking statements reflect South Plains’ current views
with respect to, among other things, the ongoing COVID-19 pandemic and other future events. Any statements about South Plains’ expectations, beliefs, plans, predictions, forecasts, objectives, assumptions or future events or performance are not
historical facts and may be forward-looking. These statements are often, but not always, made through the use of words or phrases such as “anticipate,” “believes,” “can,” “could,” “may,” “predicts,” “potential,” “should,” “will,” “estimate,” “plans,”
“projects,” “continuing,” “ongoing,” “expects,” “intends” and similar words or phrases. South Plains cautions that the forward-looking statements in this press release are based largely on South Plains’ expectations and are subject to a number of
known and unknown risks and uncertainties that are subject to change based on factors which are, in many instances, beyond South Plains’ control. Factors that could cause such changes include, but are not limited to, general economic conditions, the
extent of the impact of the COVID-19 pandemic on our customers, changes in interest rates, regulatory considerations, competition and market expansion opportunities, changes in non-interest expenditures or in the anticipated benefits of such
expenditures, and changes in applicable laws and regulations. Additional information regarding these risks and uncertainties to which South Plains’ business and future financial performance are subject is contained in South Plains’ most recent Annual
Report on Form 10-K and Quarterly Report on Form 10-Q on file with the SEC, and other documents South Plains files with the SEC from time to time. South Plains urges readers of this press release to review the “Risk
Factors” section of our most recent Annual Report on Form 10-K Quarterly Report on Form 10-Q, as well as the “Risk Factors” section of other documents South Plains files with the SEC from time to
time. Actual results, performance or achievements could differ materially from those contemplated, expressed, or implied by the forward-looking statements due to additional risks and uncertainties of which South Plains is not currently aware or which
it does not currently view as, but in the future may become, material to its business or operating results. Due to these and other possible uncertainties and risks, readers are cautioned not to place undue reliance on the forward-looking statements
contained in this press release. Any forward-looking statements presented herein are made only as of the date of this press release, and South Plains does not undertake any obligation to update or revise any forward-looking statements to reflect
changes in assumptions, new information, the occurrence of unanticipated events, or otherwise, except as required by law.
|
Contact:
|
Mikella Newsom, Chief Risk Officer and Secretary
|
|
(866) 771-3347
|
|
Source: South Plains Financial, Inc.
South Plains Financial, Inc.
Consolidated Financial Highlights - (Unaudited)
(Dollars in thousands, except share data)
|
As of and for the quarter ended
|
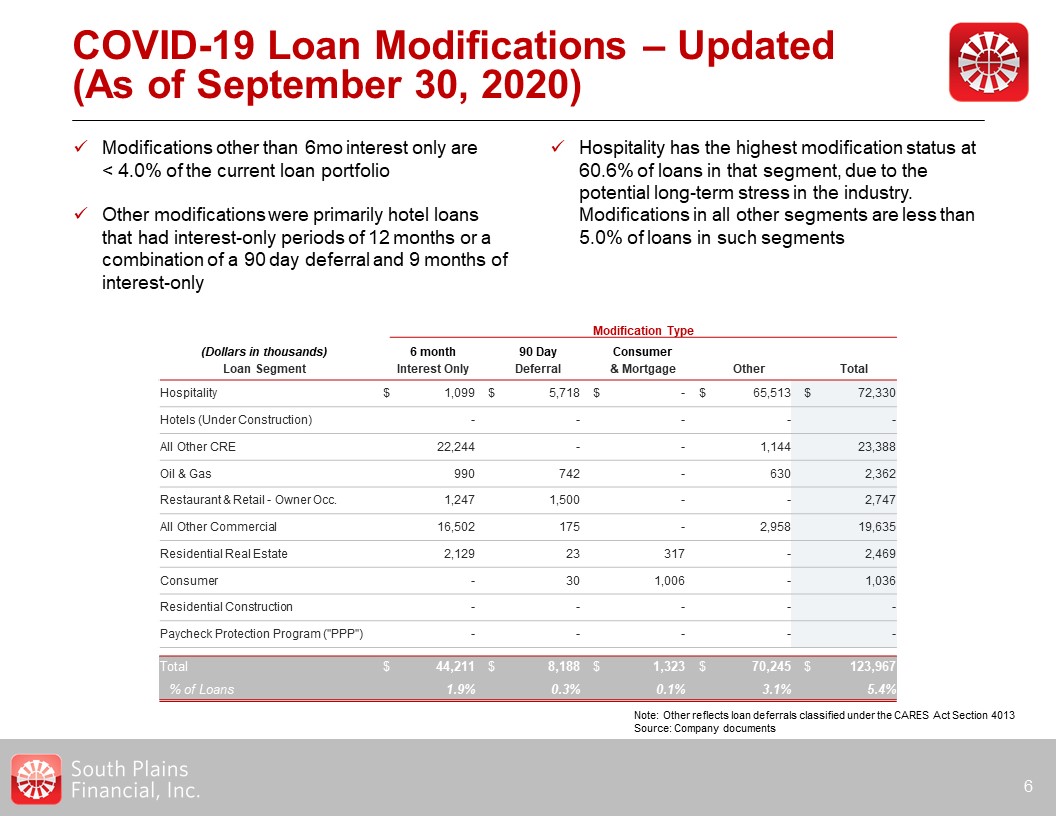
||||||||||||||||||||
|
September 30,
2020
|
June 30,
2020
|
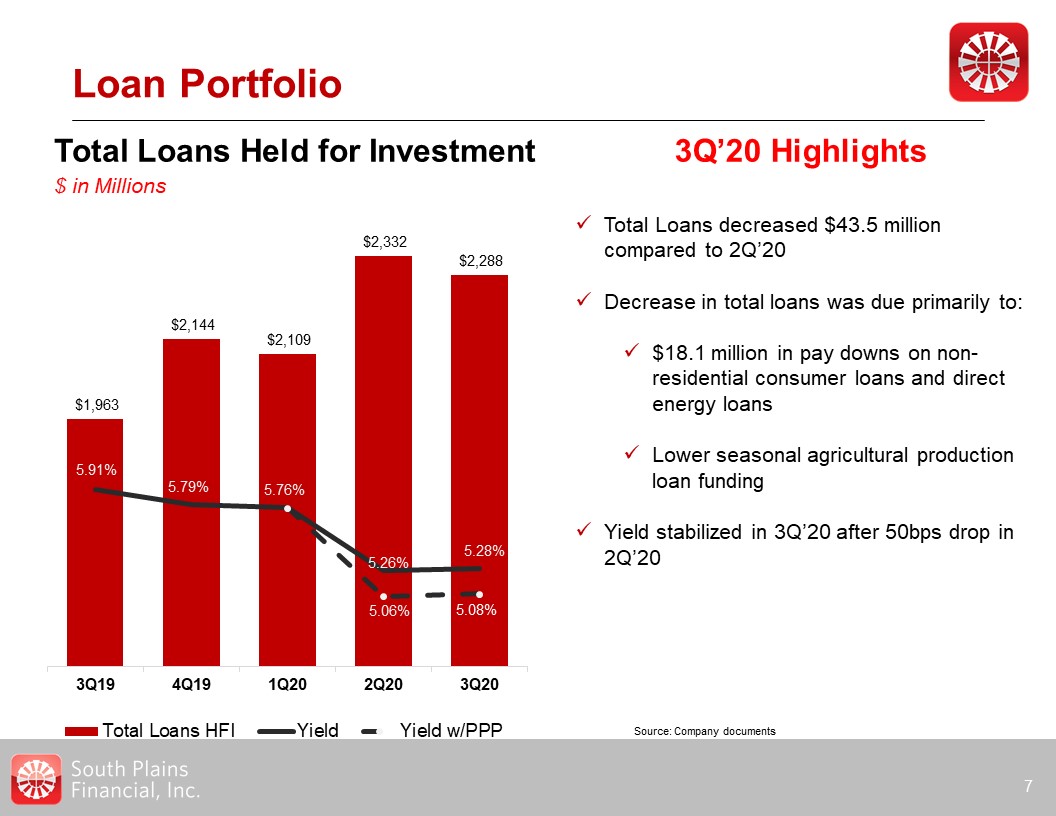
March 31,
2020
|
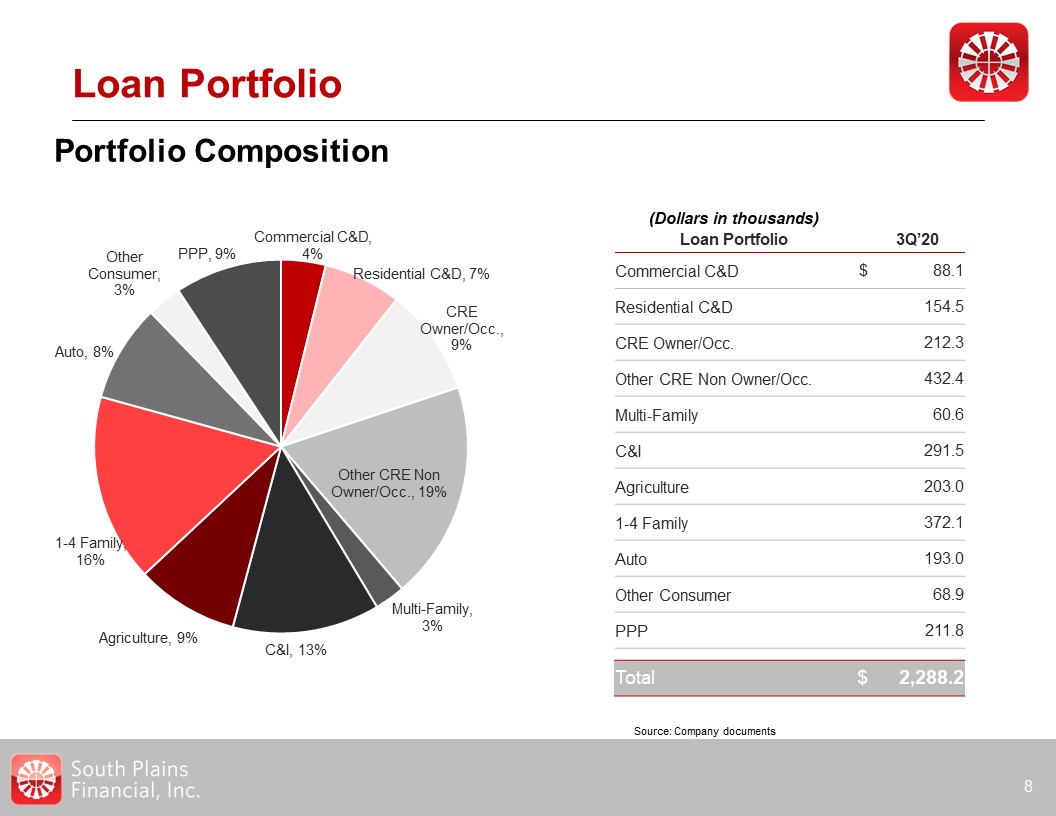
December 31,
2019
|
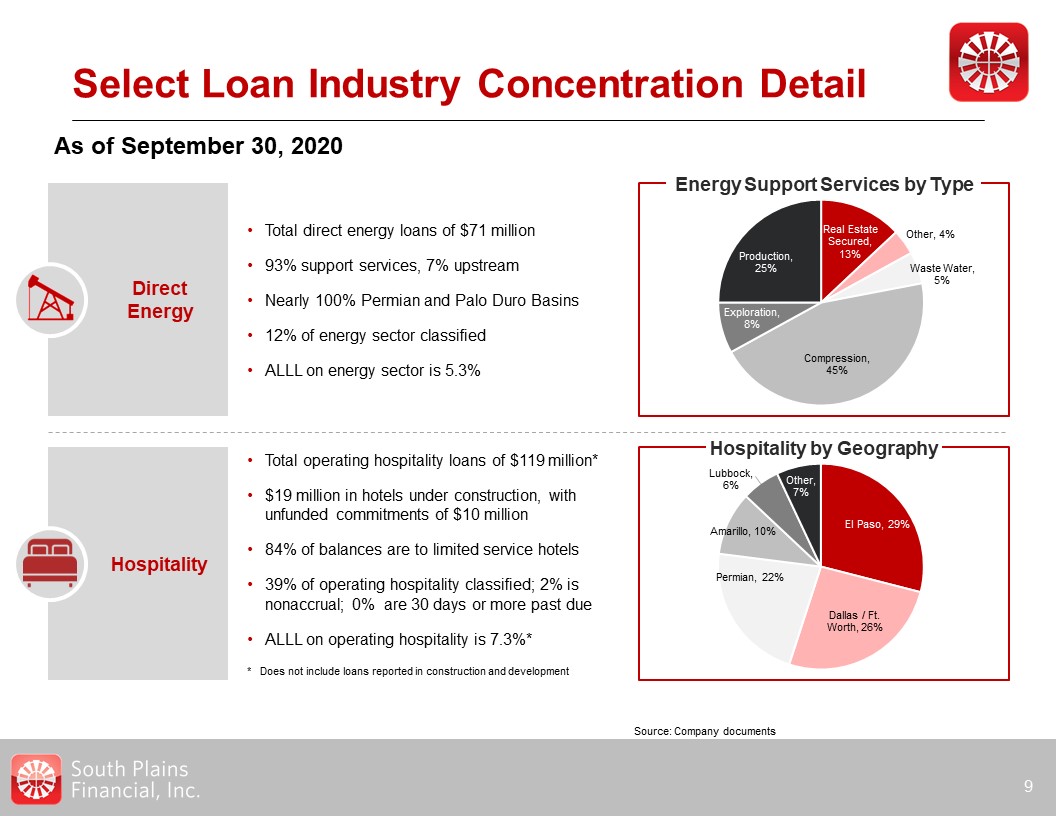
September 30,
2019
|
||||||||||||||||
|
Selected Income Statement Data:
|
||||||||||||||||||||
|
Interest income
|
$
|
34,503
|
$
|
34,007
|
$
|
35,737
|
$
|
34,764
|
$
|
33,665
|
||||||||||
|
Interest expense
|
3,230
|
3,559
|
5,538
|
6,140
|
7,097
|
|||||||||||||||
|
Net interest income
|
31,273
|
30,448
|
30,199
|
28,624
|
26,568
|
|||||||||||||||
|
Provision for loan losses
|
6,062
|
13,133
|
6,234
|
896
|
420
|
|||||||||||||||
|
Noninterest income
|
31,660
|
24,896
|
18,875
|
16,740
|
14,115
|
|||||||||||||||
|
Noninterest expense
|
35,993
|
35,207
|
34,011
|
31,714
|
30,028
|
|||||||||||||||
|
Income tax expense
|
4,147
|
1,389
|
1,746
|
2,645
|
1,977
|
|||||||||||||||
|
Net income
|
16,731
|
5,615
|
7,083
|
10,109
|
8,258
|
|||||||||||||||
|
Per Share Data (Common Stock):
|
||||||||||||||||||||
|
Net earnings, basic
|
0.93
|
0.31
|
0.39
|
0.56
|
0.46
|
|||||||||||||||
|
Net earnings, diluted
|
0.92
|
0.31
|
0.38
|
0.55
|
0.45
|
|||||||||||||||
|
Cash dividends declared and paid
|
0.03
|
0.03
|
0.03
|
0.03
|
0.03
|
|||||||||||||||
|
Book value
|
19.52
|
18.64
|
18.10
|
16.98
|
16.61
|
|||||||||||||||
|
Tangible book value
|
18.00
|
17.06
|
16.54
|
15.46
|
16.47
|
|||||||||||||||
|
Weighted average shares outstanding, basic
|
18,059,174
|
18,061,705
|
18,043,105
|
18,010,065
|
17,985,429
|
|||||||||||||||
|
Weighted average shares outstanding, dilutive
|
18,256,161
|
18,224,630
|
18,461,922
|
18,415,656
|
18,363,033
|
|||||||||||||||
|
Shares outstanding at end of period
|
18,059,174
|
18,059,174
|
18,056,014
|
18,036,115
|
18,004,323
|
|||||||||||||||
|
Selected Period End Balance Sheet Data:
|
||||||||||||||||||||
|
Cash and cash equivalents
|
290,885
|
256,101
|
136,062
|
158,099
|
244,645
|
|||||||||||||||
|
Investment securities
|
726,329
|
730,674
|
734,791
|
707,650
|
401,335
|
|||||||||||||||
|
Total loans held for investment
|
2,288,234
|
2,331,716
|
2,108,805
|
2,143,623
|
1,962,609
|
|||||||||||||||
|
Allowance for loan losses
|
46,076
|
40,635
|
29,074
|
24,197
|
24,176
|
|||||||||||||||
|
Total assets
|
3,542,666
|
3,584,532
|
3,216,563
|
3,237,167
|
2,795,582
|
|||||||||||||||
|
Interest-bearing deposits
|
2,037,743
|
2,006,984
|
1,924,902
|
1,905,936
|
1,729,741
|
|||||||||||||||
|
Noninterest-bearing deposits
|
906,059
|
940,853
|
740,946
|
790,921
|
556,233
|
|||||||||||||||
|
Total deposits
|
2,943,802
|
2,947,837
|
2,665,848
|
2,696,857
|
2,285,974
|
|||||||||||||||
|
Borrowings
|
204,704
|
252,430
|
185,265
|
205,030
|
177,720
|
|||||||||||||||
|
Total stockholders’ equity
|
352,568
|
336,534
|
326,890
|
306,182
|
299,027
|
|||||||||||||||
|
Summary Performance Ratios:
|
||||||||||||||||||||
|
Return on average assets
|
1.88
|
%
|
0.64
|
%
|
0.89
|
%
|
1.32
|
%
|
1.18
|
%
|
||||||||||
|
Return on average equity
|
19.32
|
%
|
6.81
|
%
|
9.00
|
%
|
13.25
|
%
|
11.10
|
%
|
||||||||||
|
Net interest margin (1)
|
3.82
|
%
|
3.79
|
%
|
4.13
|
%
|
4.03
|
%
|
4.07
|
%
|
||||||||||
|
Yield on loans
|
5.08
|
%
|
5.06
|
%
|
5.76
|
%
|
5.79
|
%
|
5.91
|
%
|
||||||||||
|
Cost of interest-bearing deposits
|
0.50
|
%
|
0.56
|
%
|
0.91
|
%
|
1.06
|
%
|
1.30
|
%
|
||||||||||
|
Efficiency ratio
|
56.90
|
%
|
63.28
|
%
|
69.10
|
%
|
69.71
|
%
|
73.62
|
%
|
||||||||||
|
Summary Credit Quality Data:
|
||||||||||||||||||||
|
Nonperforming loans
|
15,006
|
10,472
|
7,112
|
6,045
|
6,456
|
|||||||||||||||
|
Nonperforming loans to total loans held for investment
|
0.66
|
%
|
0.45
|
%
|
0.34
|
%
|
0.28
|
%
|
0.33
|
%
|
||||||||||
|
Other real estate owned
|
1,336
|
1,335
|
1,944
|
1,883
|
2,296
|
|||||||||||||||
|
Nonperforming assets to total assets
|
0.46
|
%
|
0.33
|
%
|
0.28
|
%
|
0.24
|
%
|
0.31
|
%
|
||||||||||
|
Allowance for loan losses to total loans held for investment
|
2.01
|
%
|
1.74
|
%
|
1.38
|
%
|
1.13
|
%
|
1.23
|
%
|
||||||||||
|
Net charge-offs to average loans outstanding (annualized)
|
0.10
|
%
|
0.27
|
%
|
0.25
|
%
|
0.17
|
%
|
0.08
|
%
|
||||||||||
|
As of and for the quarter ended
|
||||||||||||||||||||
|
September 30
2020
|
June 30,
2020
|
March 31,
2020
|
December 31,
2019
|
September 30,
2019
|
||||||||||||||||
|
Capital Ratios:
|
||||||||||||||||||||
|
Total stockholders’ equity to total assets
|
9.95
|
%
|
9.39
|
%
|
10.16
|
%
|
9.46
|
%
|
10.70
|
%
|
||||||||||
|
Tangible common equity to tangible assets
|
9.25
|
%
|
8.66
|
%
|
9.37
|
%
|
8.69
|
%
|
10.62
|
%
|
||||||||||
|
Common equity tier 1 to risk-weighted assets
|
12.49
|
%
|
10.47
|
%
|
11.24
|
%
|
11.06
|
%
|
13.10
|
%
|
||||||||||
|
Tier 1 capital to average assets
|
10.01
|
%
|
9.60
|
%
|
10.34
|
%
|
10.74
|
%
|
12.17
|
%
|
||||||||||
|
Total capital to risk-weighted assets
|
18.67
|
%
|
14.32
|
%
|
15.23
|
%
|
14.88
|
%
|
17.38
|
%
|
||||||||||
| (1) |
Net interest margin is calculated as the annual net interest income, on a fully tax-equivalent basis, divided by average interest-earning assets.
|
South Plains Financial, Inc.
Average Balances and Yields - (Unaudited)
(Dollars in thousands)
|
For the Three Months Ended
|
||||||||||||||||||||||||
|
September 30, 2020
|
September 30, 2019
|
|||||||||||||||||||||||
|
Average
Balance
|
Interest
Income
Expense
|
Yield
|
Average
Balance
|
Interest
Income
Expense
|
Yield
|
|||||||||||||||||||
|
Assets
|
||||||||||||||||||||||||
|
Loans, excluding PPP (1)
|
$
|
2,195,507
|
$
|
29,162
|
5.28
|
%
|
$
|
1,993,507
|
$
|
29,695
|
5.91
|
%
|
||||||||||||
|
Loans - PPP
|
212,337
|
1,602
|
3.00
|
%
|
-
|
-
|
0.00
|
%
|
||||||||||||||||
|
Debt securities - taxable
|
525,301
|
2,613
|
1.98
|
%
|
287,128
|
1,956
|
2.70
|
%
|
||||||||||||||||
|
Debt securities - nontaxable
|
187,400
|
1,343
|
2.85
|
%
|
32,993
|
286
|
3.44
|
%
|
||||||||||||||||
|
Other interest-bearing assets
|
168,922
|
105
|
0.25
|
%
|
284,579
|
1,831
|
2.55
|
%
|
||||||||||||||||
|
Total interest-earning assets
|
3,289,467
|
34,825
|
4.21
|
%
|
2,598,207
|
33,768
|
5.16
|
%
|
||||||||||||||||
|
Noninterest-earning assets
|
247,338
|
181,139
|
||||||||||||||||||||||
|
Total assets
|
$
|
3,536,805
|
$
|
2,779,346
|
||||||||||||||||||||
|
Liabilities & stockholders’ equity
|
||||||||||||||||||||||||
|
NOW, Savings, MMA’s
|
$
|
1,695,476
|
1,213
|
0.28
|
%
|
$
|
1,399,727
|
4,057
|
1.15
|
%
|
||||||||||||||
|
Time deposits
|
322,535
|
1,304
|
1.61
|
%
|
315,376
|
1,570
|
1.98
|
%
|
||||||||||||||||
|
Short-term borrowings
|
12,080
|
3
|
0.10
|
%
|
12,468
|
58
|
1.85
|
%
|
||||||||||||||||
|
Notes payable & other long-term borrowings
|
95,870
|
65
|
0.27
|
%
|
95,000
|
523
|
2.18
|
%
|
||||||||||||||||
|
Subordinated debt securities
|
26,472
|
403
|
6.06
|
%
|
26,472
|
404
|
6.05
|
%
|
||||||||||||||||
|
Junior subordinated deferrable interest debentures
|
46,393
|
242
|
2.08
|
%
|
46,393
|
485
|
4.15
|
%
|
||||||||||||||||
|
Total interest-bearing liabilities
|
2,198,826
|
3,230
|
0.58
|
%
|
1,895,436
|
7,097
|
1.49
|
%
|
||||||||||||||||
|
Demand deposits
|
944,420
|
555,501
|
||||||||||||||||||||||
|
Other liabilities
|
49,008
|
33,339
|
||||||||||||||||||||||
|
Stockholders’ equity
|
344,551
|
295,070
|
||||||||||||||||||||||
|
Total liabilities & stockholders’ equity
|
$
|
3,536,805
|
$
|
2,779,346
|
||||||||||||||||||||
|
Net interest income
|
$
|
31,595
|
$
|
26,671
|
||||||||||||||||||||
|
Net interest margin (2)
|
3.82
|
%
|
4.07
|
%
|
||||||||||||||||||||
| (1) |
Average loan balances include nonaccrual loans and loans held for sale.
|
| (2) |
Net interest margin is calculated as the annualized net income, on a fully tax-equivalent basis, divided by average interest-earning assets.
|
South Plains Financial, Inc.
Average Balances and Yields - (Unaudited)
(Dollars in thousands)
|
For the Nine Months Ended
|
||||||||||||||||||||||||
|
September 30, 2020
|
September 30, 2019
|
|||||||||||||||||||||||
|
Average
Balance
|
Interest
Income
Expense
|
Yield
|
Average
Balance
|
Interest
Income
Expense
|
Yield
|
|||||||||||||||||||
|
Assets
|
||||||||||||||||||||||||
|
Loans, excluding PPP (1)
|
$
|
2,188,988
|
$
|
89,041
|
5.43
|
%
|
$
|
1,965,297
|
$
|
86,471
|
5.88
|
%
|
||||||||||||
|
Loans - PPP
|
127,880
|
2,678
|
2.80
|
%
|
-
|
-
|
0.00
|
%
|
||||||||||||||||
|
Debt securities - taxable
|
544,650
|
9,285
|
2.28
|
%
|
281,904
|
5,819
|
2.76
|
%
|
||||||||||||||||
|
Debt securities - nontaxable
|
142,158
|
3,037
|
2.85
|
%
|
32,184
|
847
|
3.52
|
%
|
||||||||||||||||
|
Other interest-bearing assets
|
164,936
|
963
|
0.78
|
%
|
292,099
|
5,348
|
2.45
|
%
|
||||||||||||||||
|
Total interest-earning assets
|
3,168,612
|
105,004
|
4.43
|
%
|
2,571,484
|
98,485
|
5.12
|
%
|
||||||||||||||||
|
Noninterest-earning assets
|
248,523
|
177,507
|
||||||||||||||||||||||
|
Total assets
|
$
|
3,417,135
|
$
|
2,748,991
|
||||||||||||||||||||
|
Liabilities & stockholders’ equity
|
||||||||||||||||||||||||
|
NOW, Savings, MMA’s
|
$
|
1,630,524
|
5,199
|
0.43
|
%
|
$
|
1,439,699
|
13,287
|
1.23
|
%
|
||||||||||||||
|
Time deposits
|
334,189
|
4,361
|
1.74
|
%
|
314,128
|
4,368
|
1.86
|
%
|
||||||||||||||||
|
Short-term borrowings
|
19,758
|
102
|
0.69
|
%
|
15,425
|
226
|
1.96
|
%
|
||||||||||||||||
|
Notes payable & other long-term borrowings
|
117,726
|
518
|
0.59
|
%
|
95,000
|
1,623
|
2.28
|
%
|
||||||||||||||||
|
Subordinated debt securities
|
26,472
|
1,210
|
6.11
|
%
|
26,890
|
1,213
|
6.03
|
%
|
||||||||||||||||
|
Junior subordinated deferrable interest debentures
|
46,393
|
937
|
2.70
|
%
|
46,393
|
1,510
|
4.35
|
%
|
||||||||||||||||
|
Total interest-bearing liabilities
|
2,175,062
|
12,327
|
0.76
|
%
|
1,937,535
|
22,227
|
1.53
|
%
|
||||||||||||||||
|
Demand deposits
|
870,606
|
524,468
|
||||||||||||||||||||||
|
Other liabilities
|
40,579
|
31,795
|
||||||||||||||||||||||
|
Stockholders’ equity
|
330,888
|
255,193
|
||||||||||||||||||||||
|
Total liabilities & stockholders’ equity
|
$
|
3,417,135
|
$
|
2,748,991
|
||||||||||||||||||||
|
Net interest income
|
$
|
92,677
|
$
|
76,258
|
||||||||||||||||||||
|
Net interest margin (2)
|
3.91
|
%
|
3.96
|
%
|
||||||||||||||||||||
| (1) |
Average loan balances include nonaccrual loans and loans held for sale.
|
| (2) |
Net interest margin is calculated as the annualized net income, on a fully tax-equivalent basis, divided by average interest-earning assets.
|
South Plains Financial, Inc.
Consolidated Balance Sheets
(Unaudited)
(Dollars in thousands)
|
As of
|
||||||||
|
September 30,
2020
|
December 31,
2019
|
|||||||
|
Assets
|
||||||||
|
Cash and due from banks
|
$
|
43,750
|
$
|
56,246
|
||||
|
Interest-bearing deposits in banks
|
245,785
|
101,853
|
||||||
|
Federal funds sold
|
1,350
|
—
|
||||||
|
Investment securities
|
726,329
|
707,650
|
||||||
|
Loans held for sale
|
76,507
|
49,035
|
||||||
|
Loans held for investment
|
2,288,234
|
2,143,623
|
||||||
|
Less: Allowance for loan losses
|
(46,076
|
)
|
(24,197
|
)
|
||||
|
Net loans held for investment
|
2,242,158
|
2,119,426
|
||||||
|
Premises and equipment, net
|
61,399
|
61,873
|
||||||
|
Goodwill
|
19,508
|
18,757
|
||||||
|
Intangible assets
|
7,994
|
8,632
|
||||||
|
Other assets
|
117,886
|
113,695
|
||||||
|
Total assets
|
$
|
3,542,666
|
$
|
3,237,167
|
||||
|
Liabilities and Stockholders’ Equity Liabilities
|
||||||||
|
Noninterest bearing deposits
|
$
|
906,059
|
$
|
790,921
|
||||
|
Interest-bearing deposits
|
2,037,743
|
1,905,936
|
||||||
|
Total deposits
|
2,943,802
|
2,696,857
|
||||||
|
Other borrowings
|
82,765
|
132,165
|
||||||
|
Subordinated debt securities
|
75,546
|
26,472
|
||||||
|
Trust preferred subordinated debentures
|
46,393
|
46,393
|
||||||
|
Other liabilities
|
41,592
|
29,098
|
||||||
|
Total liabilities
|
3,190,098
|
2,930,985
|
||||||
|
Stockholders’ Equity
|
||||||||
|
Common stock
|
18,059
|
18,036
|
||||||
|
Additional paid-in capital
|
141,245
|
140,492
|
||||||
|
Retained earnings
|
174,501
|
146,696
|
||||||
|
Accumulated other comprehensive income (loss)
|
18,763
|
958
|
||||||
|
Total stockholders’ equity
|
352,568
|
306,182
|
||||||
|
Total liabilities and stockholders’ equity
|
$
|
3,542,666
|
$
|
3,237,167
|
||||
South Plains Financial, Inc.
Consolidated Statements of Income
(Unaudited)
(Dollars in thousands)
|
Three Months Ended
|
Nine Months Ended
|
|||||||||||||||
|
September 30,
2020
|
September 30,
2019
|
September 30,
2020
|
September 30,
2019
|
|||||||||||||
|
Interest income:
|
||||||||||||||||
|
Loans, including fees
|
$
|
30,724
|
$
|
29,652
|
$
|
91,600
|
$
|
86,342
|
||||||||
|
Other
|
3,779
|
4,013
|
12,647
|
11,836
|
||||||||||||
|
Total Interest income
|
34,503
|
33,665
|
104,247
|
98,178
|
||||||||||||
|
Interest expense:
|
||||||||||||||||
|
Deposits
|
2,517
|
5,627
|
9,560
|
17,655
|
||||||||||||
|
Subordinated debt securities
|
403
|
404
|
1,210
|
1,213
|
||||||||||||
|
Trust preferred subordinated debentures
|
242
|
485
|
937
|
1,510
|
||||||||||||
|
Other
|
68
|
581
|
620
|
1,849
|
||||||||||||
|
Total Interest expense
|
3,230
|
7,097
|
12,327
|
22,227
|
||||||||||||
|
Net interest income
|
31,273
|
26,568
|
91,920
|
75,951
|
||||||||||||
|
Provision for loan losses
|
6,062
|
420
|
25,429
|
1,903
|
||||||||||||
|
Net interest income after provision for loan losses
|
25,211
|
26,148
|
66,491
|
74,048
|
||||||||||||
|
Noninterest income:
|
||||||||||||||||
|
Service charges on deposits
|
1,749
|
2,101
|
5,171
|
5,985
|
||||||||||||
|
Income from insurance activities
|
3,303
|
1,114
|
5,484
|
4,074
|
||||||||||||
|
Mortgage banking activities
|
21,409
|
6,991
|
48,117
|
18,509
|
||||||||||||
|
Bank card services and interchange fees
|
2,608
|
2,192
|
7,190
|
6,273
|
||||||||||||
|
Other
|
2,591
|
1,717
|
7,151
|
5,052
|
||||||||||||
|
Total Noninterest income
|
31,660
|
14,115
|
75,431
|
39,893
|
||||||||||||
|
Noninterest expense:
|
||||||||||||||||
|
Salaries and employee benefits
|
23,672
|
18,135
|
66,103
|
56,044
|
||||||||||||
|
Net occupancy expense
|
3,710
|
3,486
|
10,896
|
10,309
|
||||||||||||
|
Professional services
|
1,177
|
1,852
|
4,710
|
5,169
|
||||||||||||
|
Marketing and development
|
615
|
762
|
2,189
|
2,275
|
||||||||||||
|
Other
|
6,819
|
5,793
|
21,313
|
16,197
|
||||||||||||
|
Total noninterest expense
|
35,993
|
30,028
|
105,211
|
89,994
|
||||||||||||
|
Income before income taxes
|
20,878
|
10,235
|
36,711
|
23,947
|
||||||||||||
|
Income tax expense (benefit)
|
4,147
|
1,977
|
7,282
|
4,836
|
||||||||||||
|
Net income
|
$
|
16,731
|
$
|
8,258
|
$
|
29,429
|
$
|
19,111
|
||||||||
South Plains Financial, Inc.
Loan Composition
(Unaudited)
(Dollars in thousands)
|
As of
|
||||||||
|
September 30,
2020
|
December 31,
2019
|
|||||||
|
Loans:
|
||||||||
|
Commercial Real Estate
|
$
|
655,432
|
$
|
658,195
|
||||
|
Commercial - Specialized
|
340,458
|
309,505
|
||||||
|
Commercial - General
|
578,181
|
441,398
|
||||||
|
Consumer:
|
||||||||
|
1-4 Family Residential
|
372,114
|
362,796
|
||||||
|
Auto Loans
|
193,023
|
215,209
|
||||||
|
Other Consumer
|
68,877
|
74,000
|
||||||
|
Construction
|
80,149
|
82,520
|
||||||
|
Total loans held for investment
|
$
|
2,288,234
|
$
|
2,143,623
|
||||
South Plains Financial, Inc.
Deposit Composition
(Unaudited)
(Dollars in thousands)
|
As of
|
||||||||
|
September 30,
2020
|
December 31,
2019
|
|||||||
|
Deposits:
|
||||||||
|
Noninterest-bearing demand deposits
|
$
|
906,059
|
$
|
790,921
|
||||
|
NOW & other transaction accounts
|
323,955
|
318,379
|
||||||
|
MMDA & other savings
|
1,391,620
|
1,231,534
|
||||||
|
Time deposits
|
322,168
|
356,023
|
||||||
|
Total deposits
|
$
|
2,943,802
|
$
|
2,696,857
|
||||
South Plains Financial, Inc.
Reconciliation of Non-GAAP Financial Measures
(Unaudited)
(Dollars in thousands)
|
As of and for the quarter ended
|
||||||||||||||||||||
|
September 30,
2020
|
June 30,
2020
|
March 31,
2020
|
December 31,
2019
|
September 30,
2019
|
||||||||||||||||
|
Efficiency ratio
|
||||||||||||||||||||
|
Noninterest expense
|
$
|
35,993
|
$
|
35,207
|
$
|
34,011
|
$
|
31,714
|
$
|
30,028
|
||||||||||
|
Net interest income
|
$
|
31,273
|
$
|
30,448
|
$
|
30,199
|
$
|
28,624
|
$
|
26,568
|
||||||||||
|
Tax equivalent yield adjustment
|
322
|
290
|
145
|
133
|
103
|
|||||||||||||||
|
Noninterest income
|
31,660
|
24,896
|
18,875
|
16,740
|
14,115
|
|||||||||||||||
|
Total income
|
$
|
63,255
|
$
|
55,634
|
$
|
49,219
|
$
|
45,497
|
$
|
40,786
|
||||||||||
|
Efficiency ratio
|
56.90
|
%
|
63.28
|
%
|
69.10
|
%
|
69.71
|
%
|
73.62
|
%
|
||||||||||
|
Noninterest expense
|
$
|
35,993
|
$
|
35,207
|
$
|
34,011
|
$
|
31,714
|
$
|
30,028
|
||||||||||
|
Less: net loss on sale of securities
|
-
|
-
|
-
|
(27
|
)
|
-
|
||||||||||||||
|
Adjusted noninterest expense
|
$
|
35,993
|
$
|
35,207
|
$
|
34,011
|
$
|
31,687
|
$
|
30,028
|
||||||||||
|
Total income
|
$
|
63,255
|
$
|
55,634
|
$
|
49,219
|
$
|
45,497
|
$
|
40,786
|
||||||||||
|
Less: net gain on sale of securities
|
-
|
-
|
(2,318
|
)
|
-
|
-
|
||||||||||||||
|
Adjusted total income
|
$
|
63,255
|
$
|
55,634
|
$
|
46,901
|
$
|
45,497
|
$
|
40,786
|
||||||||||
|
Adjusted efficiency ratio
|
56.90
|
%
|
63.28
|
%
|
72.52
|
%
|
69.65
|
%
|
73.62
|
%
|
||||||||||
|
Pre-tax, pre-provision income
|
||||||||||||||||||||
|
Net income
|
$
|
16,731
|
$
|
5,615
|
$
|
7,083
|
$
|
10,109
|
$
|
8,258
|
||||||||||
|
Income tax expense
|
4,147
|
1,389
|
1,746
|
2,645
|
1,977
|
|||||||||||||||
|
Provision for loan losses
|
6,062
|
13,133
|
6,234
|
896
|
420
|
|||||||||||||||
|
Pre-tax, pre-provision income
|
$
|
26,940
|
$
|
20,137
|
$
|
15,063
|
$
|
13,650
|
$
|
10,655
|
||||||||||
South Plains Financial, Inc.
Reconciliation of Non-GAAP Financial Measures
(Unaudited)
(Dollars in thousands)
|
As of
|
||||||||
|
September 30,
2020
|
December 31,
2019
|
|||||||
|
Tangible common equity
|
||||||||
|
Total common stockholders’ equity
|
$
|
352,568
|
$
|
306,182
|
||||
|
Less: goodwill and other intangibles
|
(27,502
|
)
|
(27,389
|
)
|
||||
|
Tangible common equity
|
$
|
325,066
|
$
|
278,793
|
||||
|
Tangible assets
|
||||||||
|
Total assets
|
$
|
3,542,666
|
$
|
3,237,167
|
||||
|
Less: goodwill and other intangibles
|
(27,502
|
)
|
(27,389
|
)
|
||||
|
Tangible assets
|
$
|
3,515,164
|
$
|
3,209,778
|
||||
|
Shares outstanding
|
18,059,174
|
18,036,115
|
||||||
|
Total stockholders’ equity to total assets
|
9.95
|
%
|
9.46
|
%
|
||||
|
Tangible common equity to tangible assets
|
9.25
|
%
|
8.69
|
%
|
||||
|
Book value per share
|
$
|
19.52
|
$
|
16.98
|
||||
|
Tangible book value per share
|
$
|
18.00
|
$
|
15.46
|
||||
Exhibit 99.2
South Plains Financial Earnings Presentation Third Quarter, 2020 1
Safe Harbor Statement and Other Disclosures FORWARD-LOOKING STATEMENTSThis presentation contains, and
future oral and written statements of South Plains Financial, Inc. (“South Plains” or the “Company”) and City Bank (“or the “Bank”) may contain, statements about future events that constitute forward-looking statements within the meaning of the
Private Securities Litigation Reform Act of 1995. These forward-looking statements reflect South Plains’ current views with respect to, among other things, future events and South Plains’ financial performance. Any statements about South
Plains’ expectations, beliefs, plans, predictions, forecasts, objectives, assumptions or future events or performance are not historical facts and may be forward-looking. These statements are often, but not always, made through the use of words
or phrases such as “anticipate,” “believes,” “can,” “could,” “may,” “predicts,” “potential,” “should,” “will,” “estimate,” “plans,” “projects,” “continuing,” “ongoing,” “expects,” “intends” and similar words or phrases. Forward-looking
statements include, but are not limited to: (i) projections and estimates of revenues, expenses, income or loss, earnings or loss per share, and other financial items, including our estimated financial results for 2020, (ii) statements of
plans, objectives and expectations of South Plains or its management, (iii) statements of future economic performance, and (iv) statements of assumptions underlying such statements. Forward-looking statements should not be relied on because
they involve known and unknown risks, uncertainties and other factors, some of which are beyond the control of South Plains and City Bank. These risks, uncertainties and other factors may cause the actual results, performance, and achievements
of South Plains and City Bank to be materially different from the anticipated future results, performance or achievements expressed in, or implied by, the forward-looking statements. Factors that could cause such differences include, but are
not limited to, local, regional, national and international economic conditions, the extent of the impact of the COVID-19 pandemic, including the impact of actions taken by governmental and regulatory authorities in response to such pandemic,
such as the Coronavirus Aid, Relief, and Economic Security Act and subsequent related legislations, and the programs established thereunder, and City Bank’s participation in such programs, volatility of the financial markets, changes in
interest rates, regulatory considerations, competition and market expansion opportunities, changes in non-interest expenditures or in the anticipated benefits of such expenditures, the receipt of required regulatory approvals, changes in
non-performing assets and charge-offs, changes in tax laws, current or future litigation, regulatory examinations or other legal and/or regulatory actions, the impact of any tariffs, terrorist threats and attacks, acts of war or threats thereof
or other pandemics. Therefore, South Plains can give no assurance that the results contemplated in the forward-looking statements will be realized. For more information about these factors, please see South Plains’ reports filed with or
furnished to the SEC, including South Plains’ most recent Annual Report on Form 10-K and Quarterly Report on Form 10-Q on file with the U.S. Securities and Exchange Commission (the “SEC”), including the sections entitled "Risk Factors" and
"Management's Discussion and Analysis of Financial Condition and Results of Operations." Further, any forward-looking statement speaks only as of the date on which it is made and South Plains undertakes no obligation to update or revise any
forward-looking statement to reflect events or circumstances after the date on which the statement is made or to reflect the occurrence of unanticipated events, except as required by law. All forward-looking statements herein are qualified by
this cautionary statement.NON-GAAP FINANCIAL MEASURESManagement believes that certain non-GAAP performance measures used in this presentation provide meaningful information about underlying trends in its business and operations. Non-GAAP
financial measures should be viewed in addition to, and not as an alternative for, SPFI’s reported results prepared in accordance with GAAP. Numbers in this presentation may not sum due to rounding. 2

Today’s Speakers 3 Curtis C. GriffithChairman & Chief Executive Officer Elected to the board of
directors of First State Bank of Morton, Texas, in 1972 and employed by it in 1979Elected Chairman of the First State Bank of Morton board in 1984Chairman of the Board of City Bank and the Company since 1993 Steven B. CrockettChief Financial
Officer & Treasurer Began his career in public accounting in 1994 by serving for seven years with a local firm in Lubbock, TexasAppointed Chief Financial Officer in 2015Controller of the Bank and the Company for 14 and 5 years
respectively Cory T. NewsomPresident Entire banking career with the Company focused on lending and operationsAppointed President and Chief Executive Officer of the Bank in 2008Joined the Board in 2008 Brent A. BatesCity Bank’s Chief Credit
Officer Joined City Bank in February 2020Division Credit Officer for Simmons First National CorpEVP and Chief Credit Officer of Southwest Bancorp, Inc.
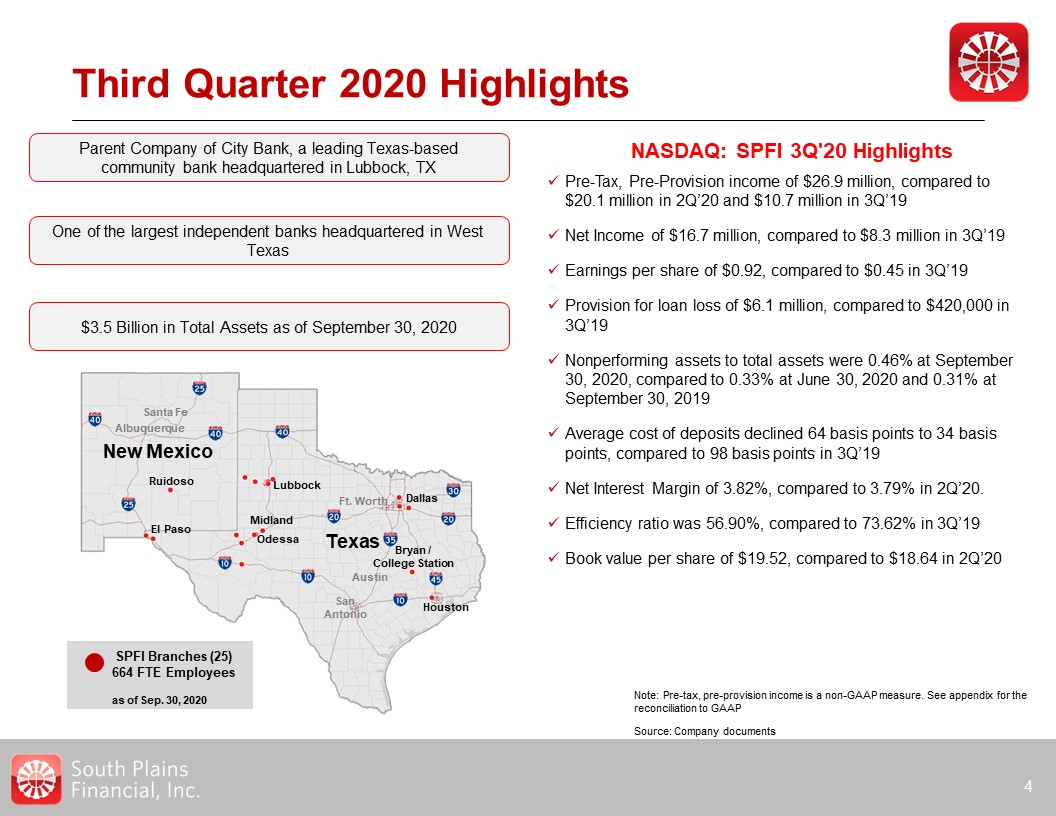
$3.5 Billion in Total Assets as of September 30, 2020 Parent Company of City Bank, a leading Texas-based
community bank headquartered in Lubbock, TX Third Quarter 2020 Highlights 4 Pre-Tax, Pre-Provision income of $26.9 million, compared to $20.1 million in 2Q’20 and $10.7 million in 3Q’19Net Income of $16.7 million, compared to $8.3 million in
3Q’19Earnings per share of $0.92, compared to $0.45 in 3Q’19Provision for loan loss of $6.1 million, compared to $420,000 in 3Q’19Nonperforming assets to total assets were 0.46% at September 30, 2020, compared to 0.33% at June 30, 2020 and
0.31% at September 30, 2019Average cost of deposits declined 64 basis points to 34 basis points, compared to 98 basis points in 3Q’19Net Interest Margin of 3.82%, compared to 3.79% in 2Q’20. Efficiency ratio was 56.90%, compared to 73.62% in
3Q’19Book value per share of $19.52, compared to $18.64 in 2Q’20 NASDAQ: SPFI 3Q'20 Highlights One of the largest independent banks headquartered in West Texas New Mexico Texas Dallas Bryan /College Station Houston Midland Odessa El
Paso Lubbock Ruidoso SanAntonio Ft. Worth Austin Albuquerque Santa Fe SPFI Branches (25)664 FTE Employees Note: Pre-tax, pre-provision income is a non-GAAP measure. See appendix for the reconciliation to GAAP as of Sep. 30,
2020 Source: Company documents
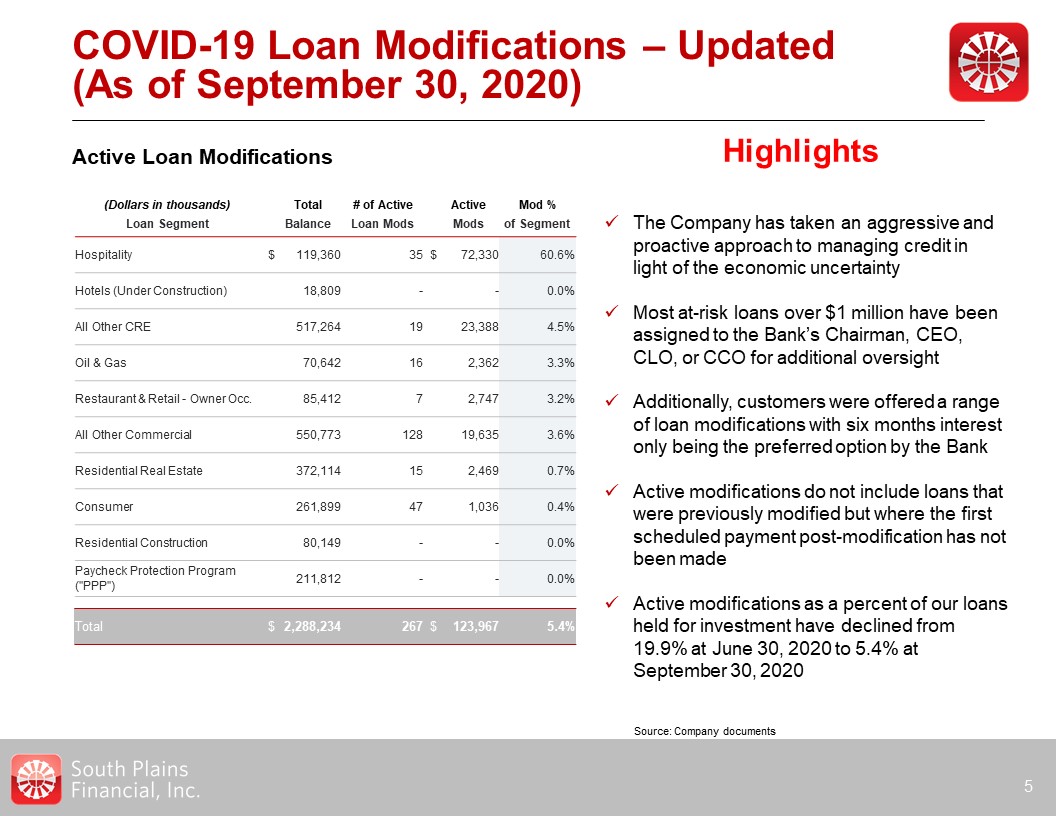
(Dollars in thousands) Total # of Active Active Mod % Loan Segment Balance Loan
Mods Mods of Segment Hospitality $ 119,360 35 $ 72,330 60.6% Hotels (Under Construction) 18,809 - - 0.0% All Other CRE 517,264 19 23,388 4.5% Oil & Gas 70,642 16 2,362
3.3% Restaurant & Retail - Owner Occ. 85,412 7 2,747 3.2% All Other Commercial 550,773 128 19,635 3.6% Residential Real Estate 372,114 15 2,469 0.7% Consumer 261,899 47
1,036 0.4% Residential Construction 80,149 - - 0.0% Paycheck Protection Program ("PPP") 211,812 - - 0.0% Total $ 2,288,234 267 $ 123,967 5.4% COVID-19 Loan Modifications –
Updated (As of September 30, 2020) 5 The Company has taken an aggressive and proactive approach to managing credit in light of the economic uncertaintyMost at-risk loans over $1 million have been assigned to the Bank’s Chairman, CEO, CLO,
or CCO for additional oversightAdditionally, customers were offered a range of loan modifications with six months interest only being the preferred option by the BankActive modifications do not include loans that were previously modified but
where the first scheduled payment post-modification has not been madeActive modifications as a percent of our loans held for investment have declined from 19.9% at June 30, 2020 to 5.4% at September 30, 2020 Highlights Active Loan
Modifications Source: Company documents
COVID-19 Loan Modifications – Updated (As of September 30, 2020) 6 Modifications other than 6mo
interest only are < 4.0% of the current loan portfolioOther modifications were primarily hotel loans that had interest-only periods of 12 months or a combination of a 90 day deferral and 9 months of interest-only Hospitality has the highest
modification status at 60.6% of loans in that segment, due to the potential long-term stress in the industry. Modifications in all other segments are less than 5.0% of loans in such segments Note: Other reflects loan deferrals classified under
the CARES Act Section 4013Source: Company documents Modification Type (Dollars in thousands) 6 month 90 Day Consumer Loan Segment Interest Only Deferral &
Mortgage Other Total Hospitality $ 1,099 $ 5,718 $ - $ 65,513 $ 72,330 Hotels (Under Construction) - - - - - All Other CRE 22,244 - - 1,144 23,388 Oil
& Gas 990 742 - 630 2,362 Restaurant & Retail - Owner Occ. 1,247 1,500 - - 2,747 All Other Commercial 16,502 175 - 2,958 19,635 Residential
Real Estate 2,129 23 317 - 2,469 Consumer - 30 1,006 - 1,036 Residential Construction - - - - - Paycheck Protection Program ("PPP") - -
- - - Total $ 44,211 $ 8,188 $ 1,323 $ 70,245 $ 123,967 % of Loans 1.9% 0.3% 0.1% 3.1% 5.4%
Loan Portfolio 7 Total Loans decreased $43.5 million compared to 2Q’20Decrease in total loans was due
primarily to:$18.1 million in pay downs on non-residential consumer loans and direct energy loansLower seasonal agricultural production loan funding Yield stabilized in 3Q’20 after 50bps drop in 2Q’20 3Q’20 Highlights Total Loans Held for
Investment$ in Millions Source: Company documents
Loan Portfolio 8 Portfolio Composition (Dollars in thousands) Loan
Portfolio 3Q’20 Commercial C&D $ 88.1 Residential C&D 154.5 CRE Owner/Occ. 212.3 Other CRE Non Owner/Occ. 432.4 Multi-Family 60.6 C&I 291.5 Agriculture 203.0 1-4 Family 372.1
Auto 193.0 Other Consumer 68.9 PPP 211.8 Total $ 2,288.2 Source: Company documents
Hospitality Select Loan Industry Concentration Detail 9 As of September 30,
2020 DirectEnergy Total direct energy loans of $71 million93% support services, 7% upstreamNearly 100% Permian and Palo Duro Basins12% of energy sector classifiedALLL on energy sector is 5.3% Total operating hospitality loans of $119
million*$19 million in hotels under construction, with unfunded commitments of $10 million84% of balances are to limited service hotels39% of operating hospitality classified; 2% is nonaccrual; 0% are 30 days or more past dueALLL on operating
hospitality is 7.3%** Does not include loans reported in construction and development Energy Support Services by Type Hospitality by Geography Source: Company documents
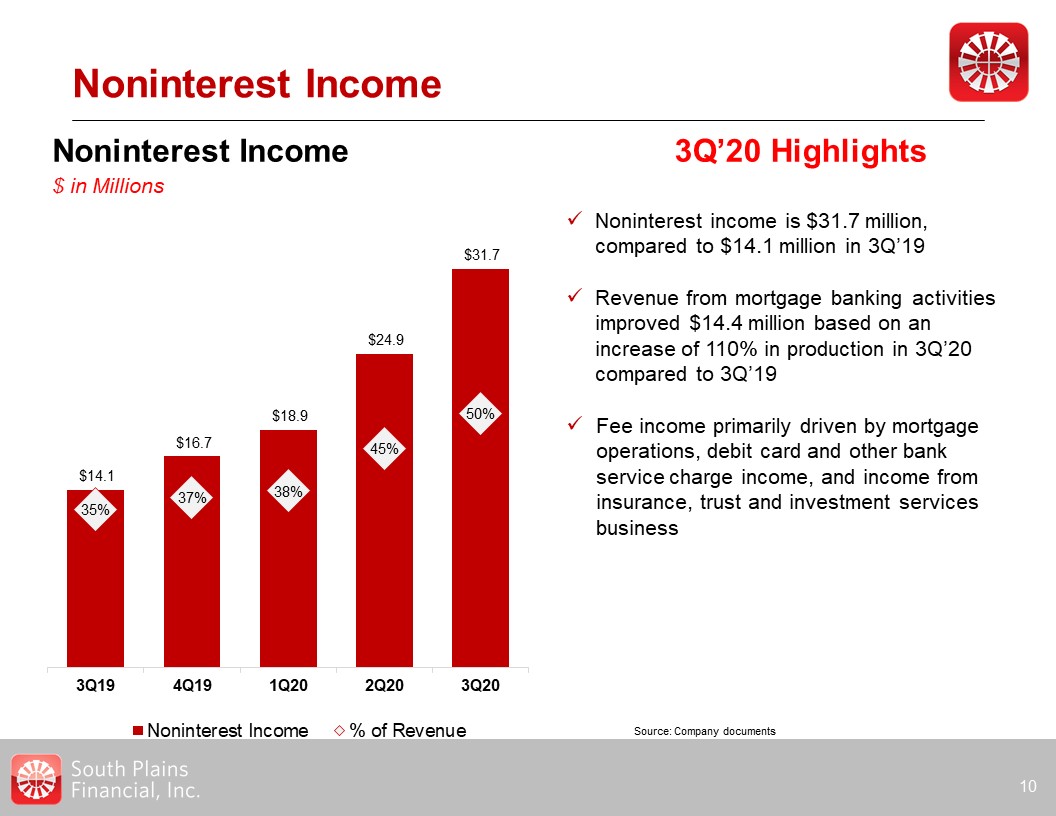
Noninterest Income 10 Noninterest Income$ in Millions 3Q’20 Highlights Noninterest income is $31.7
million, compared to $14.1 million in 3Q’19Revenue from mortgage banking activities improved $14.4 million based on an increase of 110% in production in 3Q’20 compared to 3Q’19Fee income primarily driven by mortgage operations, debit card and
other bank service charge income, and income from insurance, trust and investment services business Source: Company documents
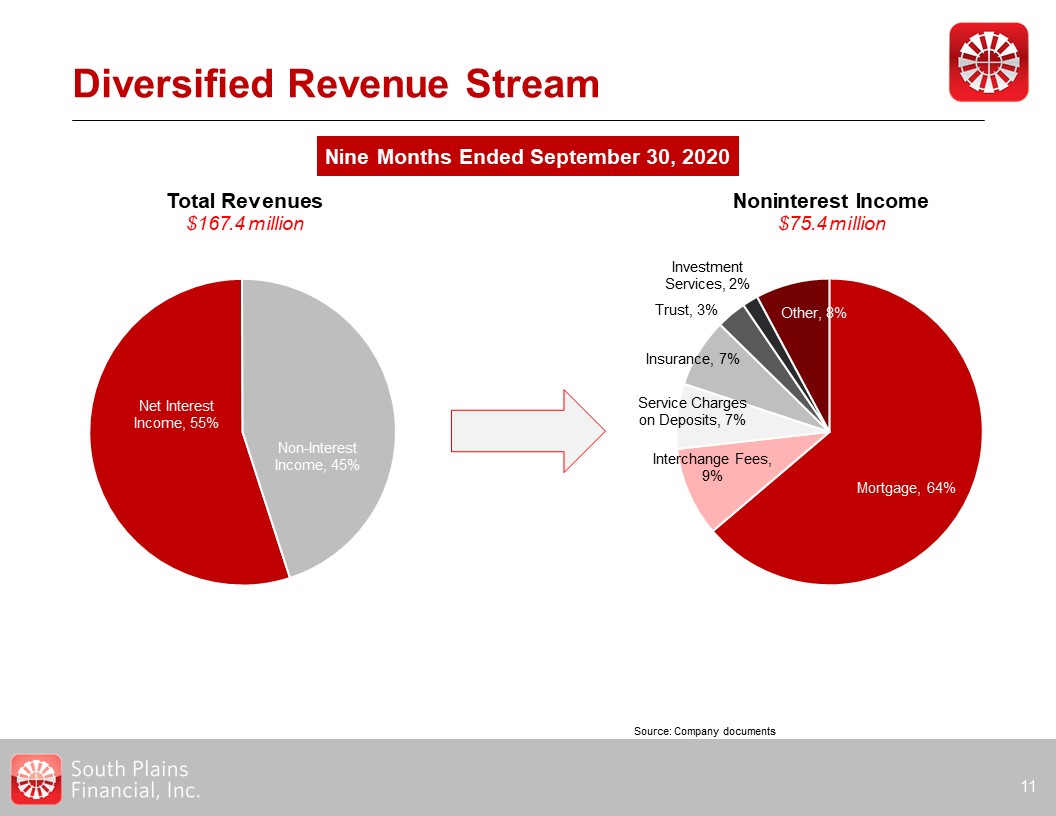
Diversified Revenue Stream Nine Months Ended September 30, 2020 11 Total Revenues$167.4
million Noninterest Income$75.4 million Source: Company documents

Net Interest Income and Margin 12 Net Interest Income & Margin$ in Millions 3Q’20
Highlights Net interest income of $31.3 million, compared to $26.6 million in 3Q’19The increase as compared to 3Q’19 was a result of:$414 million rise in average loans primarily from the WTSB acquisition and PPP loans partially offset by a
decrease in overall rates in 1Q’20 Source: Company documents
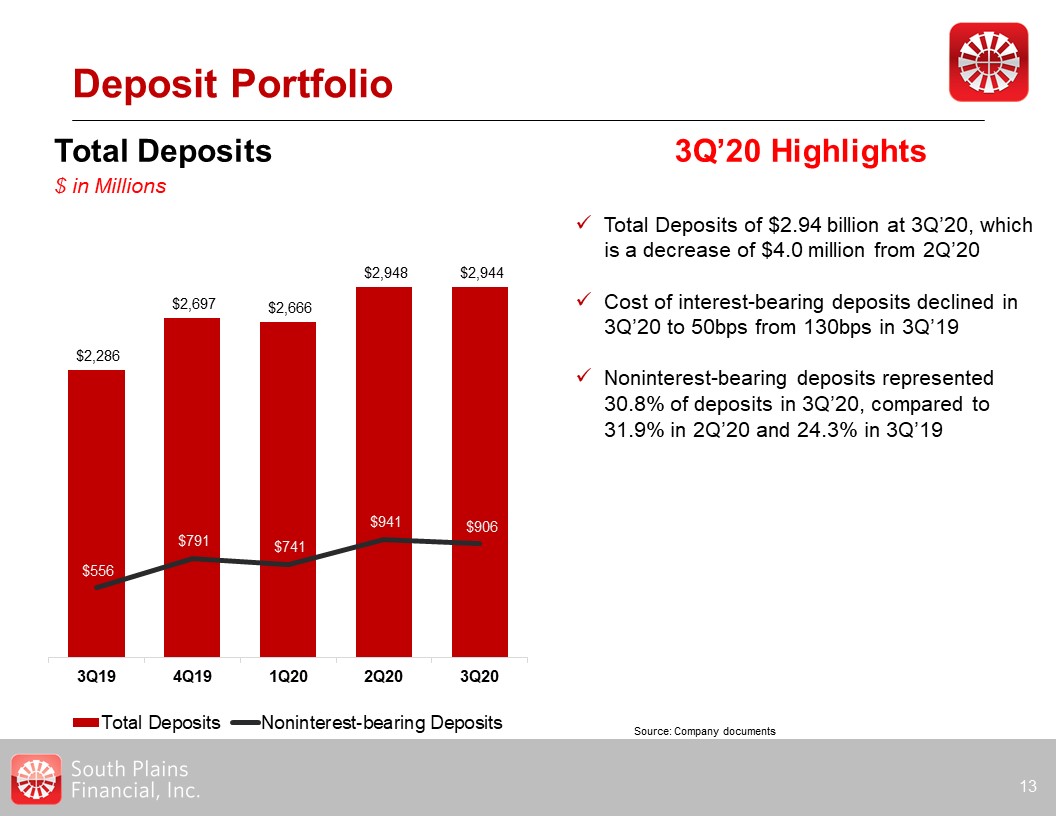
Deposit Portfolio 13 Total Deposits$ in Millions 3Q’20 Highlights Total Deposits of $2.94 billion at
3Q’20, which is a decrease of $4.0 million from 2Q’20Cost of interest-bearing deposits declined in 3Q’20 to 50bps from 130bps in 3Q’19Noninterest-bearing deposits represented 30.8% of deposits in 3Q’20, compared to 31.9% in 2Q’20 and 24.3% in
3Q’19 Source: Company documents

Credit Quality 14 3Q’20 Highlights Credit Quality Ratios Recorded a $6.1 million provision for loan
losses in 3Q’20 as compared to $13.1 million in 2Q’20 as the result of modest improvements in the economy Total classified loans decreased $3 million in 3Q’20Nonaccrual loans increased $6 million in 3Q’20 related to one customer in the
transportation industry Net Charge-Offs to Average Loans ALLL to Total Loans HFI Source: Company documents
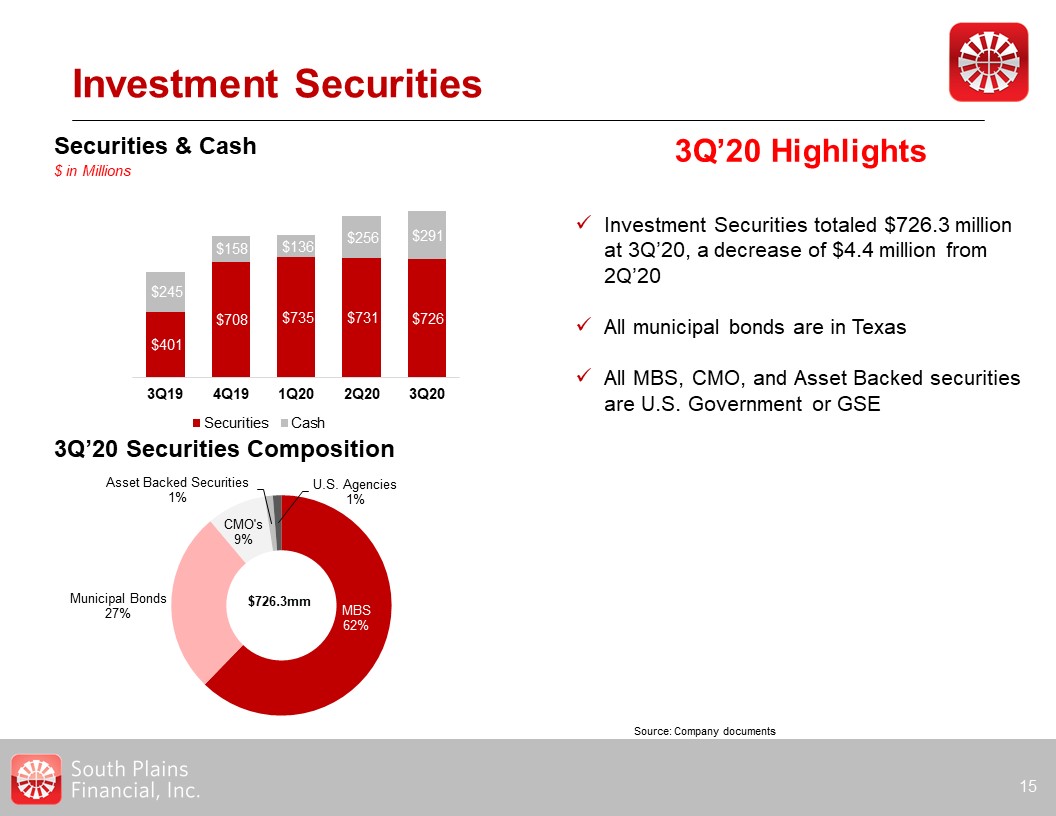
Investment Securities 15 3Q’20 Highlights Investment Securities totaled $726.3 million at 3Q’20, a
decrease of $4.4 million from 2Q’20All municipal bonds are in TexasAll MBS, CMO, and Asset Backed securities are U.S. Government or GSE 3Q’20 Securities Composition $726.3mm Securities & Cash$ in Millions Source: Company documents
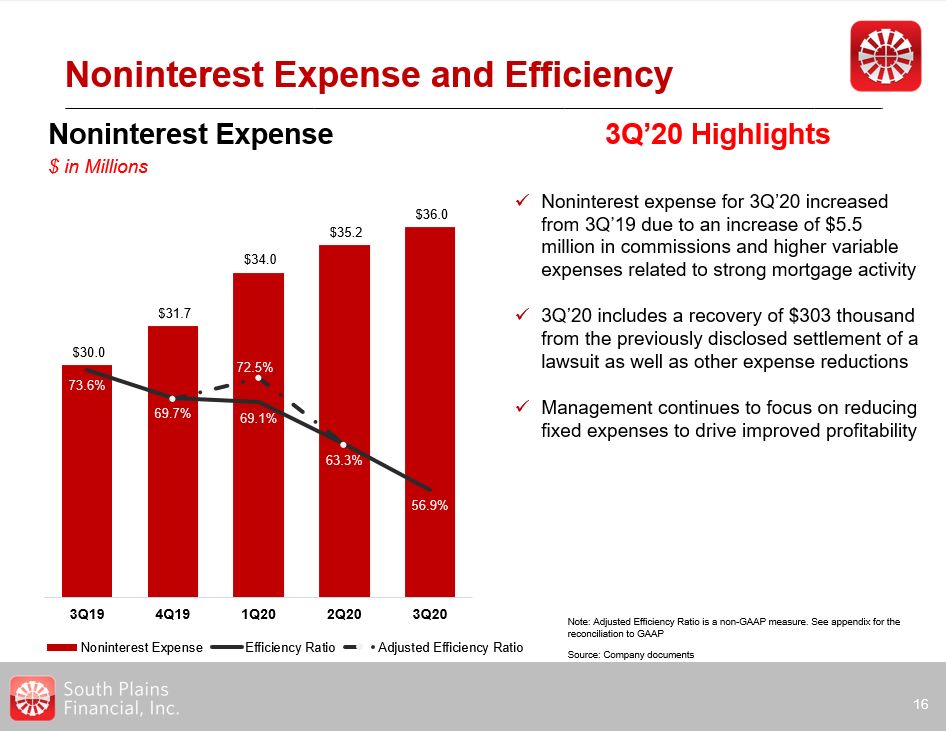
Noninterest Expense and Efficiency 16 Noninterest Expense$ in Millions 3Q’20 Highlights Noninterest
expense for 3Q’20 increased from 3Q’19 due to an increase of $5.5 million in commissions and higher variable expenses related to strong mortgage activity3Q’20 includes a recovery of $303 thousand from the previously disclosed settlement of a
lawsuit as well as other expense reductionsManagement continues to focus on reducing fixed expenses to drive improved profitability Note: Adjusted Efficiency Ratio is a non-GAAP measure. See appendix for the reconciliation to GAAP Source:
Company documents
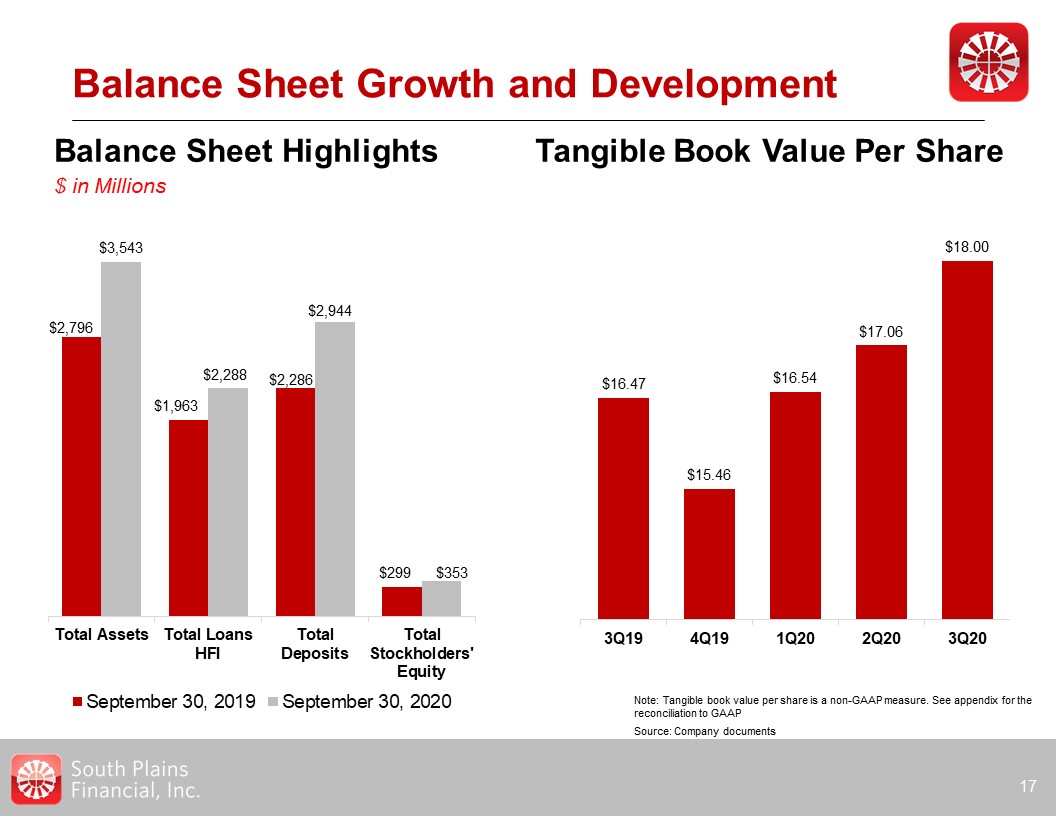
Balance Sheet Highlights$ in Millions Balance Sheet Growth and Development 17 Tangible Book Value
Per Share Note: Tangible book value per share is a non-GAAP measure. See appendix for the reconciliation to GAAP Source: Company documents
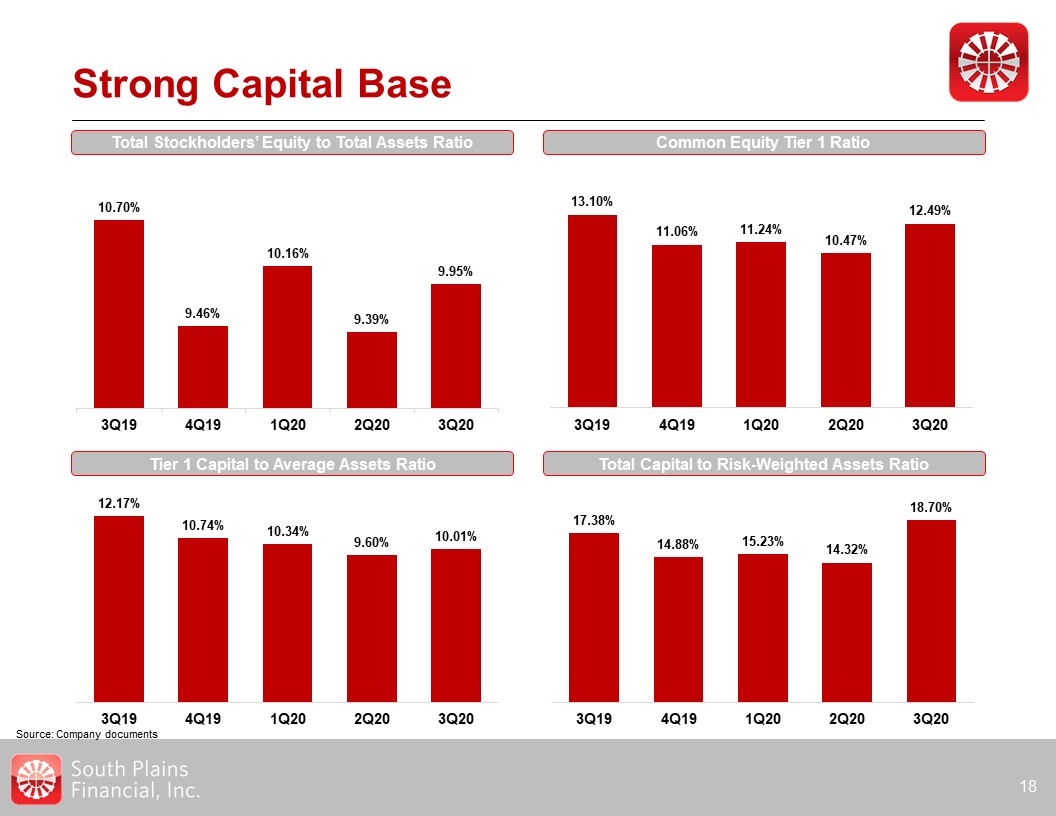
Strong Capital Base 18 Total Stockholders’ Equity to Total Assets Ratio Common Equity Tier 1
Ratio Tier 1 Capital to Average Assets Ratio Total Capital to Risk-Weighted Assets Ratio Source: Company documents

Appendix 19
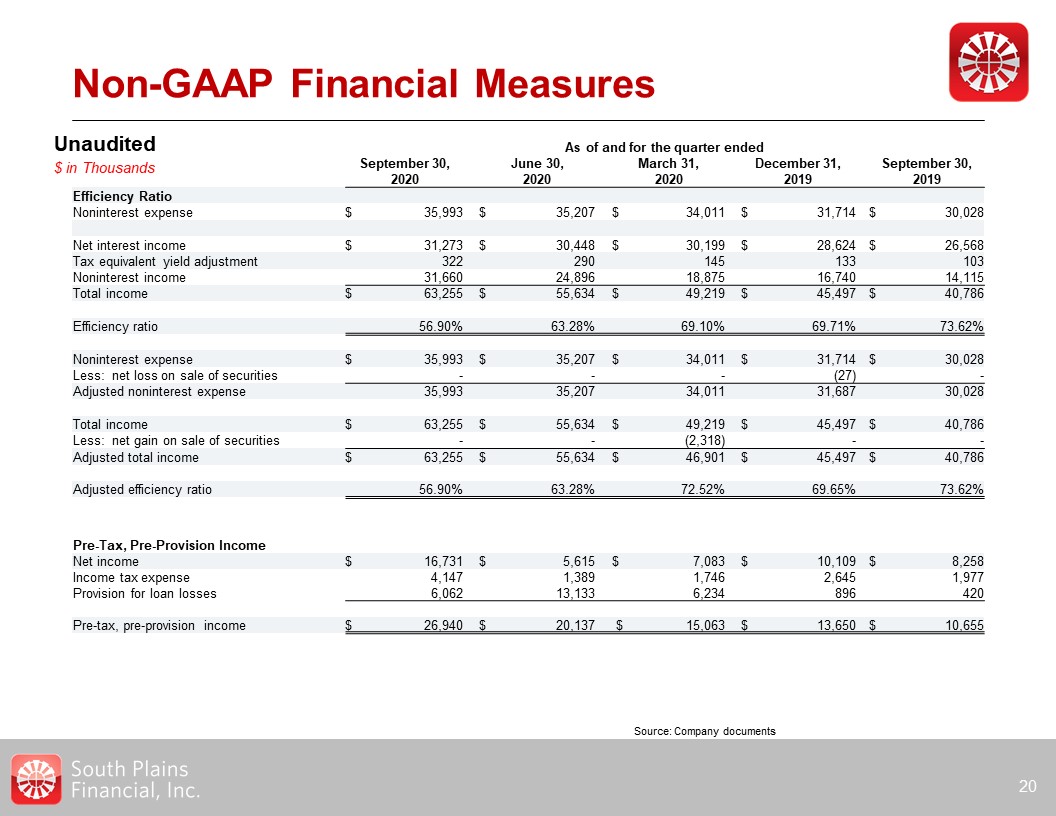
Non-GAAP Financial Measures 20 As of and for the quarter ended
September 30,2020 June 30,2020 March 31,2020 December 31,2019 September 30,2019 Efficiency Ratio Noninterest expense $ 35,993 $ 35,207 $ 34,011 $ 31,714
$ 30,028 Net interest income $ 31,273 $ 30,448 $ 30,199 $ 28,624 $ 26,568 Tax equivalent yield adjustment 322 290 145 133 103 Noninterest
income 31,660 24,896 18,875 16,740 14,115 Total income $ 63,255 $ 55,634 $ 49,219 $ 45,497 $ 40,786 Efficiency ratio
56.90% 63.28% 69.10% 69.71% 73.62% Noninterest expense $ 35,993 $ 35,207 $ 34,011 $ 31,714 $ 30,028 Less: net loss on sale of securities - -
- (27) - Adjusted noninterest expense 35,993 35,207 34,011 31,687 30,028 Total income $ 63,255 $ 55,634 $ 49,219 $ 45,497
$ 40,786 Less: net gain on sale of securities - - (2,318) - - Adjusted total income $ 63,255 $ 55,634 $ 46,901 $ 45,497 $ 40,786
Adjusted efficiency ratio 56.90% 63.28% 72.52% 69.65% 73.62% Unaudited$ in Thousands Pre-Tax, Pre-Provision Income Net income $ 16,731 $ 5,615 $ 7,083
$ 10,109 $ 8,258 Income tax expense 4,147 1,389 1,746 2,645 1,977 Provision for loan losses 6,062 13,133 6,234 896 420
Pre-tax, pre-provision income $ 26,940 $ 20,137 $ 15,063 $ 13,650 $ 10,655 Source: Company documents

Non-GAAP Financial Measures 21 As of September 30,2020 December
31,2019 Tangible common equity Total common stockholders' equity $ 352,568 $ 306,182 Less: goodwill and other intangibles (27,502) (27,389) Tangible common equity $ 325,066
$ 278,793 Tangible assets Total assets $ 3,542,666 $ 3,237,167 Less: goodwill and other intangibles (27,502) (27,389) Tangible assets $ 3,515,164 $ 3,209,778
Shares outstanding 18,059,174 18,036,115 Total stockholders' equity to total assets 9.95% 9.46% Tangible common equity to tangible assets 9.25% 8.69% Book value per
share $ 19.52 $ 16.98 Tangible book value per share $ 18.00 $ 15.46 Unaudited$ in Thousands Source: Company documents