UNITED STATES
SECURITIES AND EXCHANGE COMMISSION
Washington, D.C. 20549
FORM 8-K
CURRENT REPORT
Pursuant to Section 13 or 15(d) of
the Securities Exchange Act of 1934
Date of Report (Date of earliest event reported): January 27, 2022
(Exact name of registrant as specified in its charter)
|
|
|
|
|
(State or other jurisdiction of incorporation)
|
(Commission File Number)
|
(IRS Employer Identification No.)
|
|
|
|
|
|
(Address of principal executive offices)
|
(Zip Code)
|
(806 ) 792-7101
(Registrant’s telephone number, including area code)
Check the appropriate box below if the Form 8-K filing is intended to simultaneously satisfy the filing obligation of the registrant under any of the following provisions:
|
Written communications pursuant to Rule 425 under the Securities Act (17 CFR 230.425)
|
|
Soliciting material pursuant to Rule 14a-12 under the Exchange Act (17 CFR 240.14a-12)
|
|
Pre-commencement communications pursuant to Rule 14d-2(b) under the Exchange Act (17 CFR 240.14d-2(b))
|
|
Pre-commencement communications pursuant to Rule 13e-4(c) under the Exchange Act (17 CFR 240.13e-4(c))
|
Securities registered pursuant to Section 12(b) of the Act:
|
Title of each class
|
Trading Symbol(s)
|
Name of each exchange on which registered
|
|
|
|
|
Indicate by check mark whether the registrant is an emerging growth company as defined in Rule 405 of the Securities Act of 1933 (§230.405 of this chapter) or Rule 12b-2 of the Securities Exchange Act of 1934 (§240.12b-2 of this chapter).
Emerging growth company ☒
If an emerging growth company, indicate by check mark if the registrant has elected not to use the extended transition period for complying with any new or revised financial accounting standards provided pursuant to
Section 13(a) of the Exchange Act. ☐
| Item 2.02 |
Results of Operations and Financial Condition.
|
On January 27, 2022, South Plains Financial, Inc. (the “Company”) issued a press release announcing its financial results for the fourth quarter and year ended December 31, 2021. A copy of the Company’s press release covering such announcement and certain other
matters is furnished as Exhibit 99.1 to this Current Report on Form 8-K.
| Item 7.01 |
Regulation FD Disclosure.
|
On January 27, 2022, officers of the Company will have a conference call with respect to the Company’s
financial results for the fourth quarter and year ended December 31, 2021. An earnings release slide presentation highlighting the Company’s financial results for the fourth quarter and year ended December 31, 2021 is furnished as Exhibit 99.2
to this Current Report on Form 8-K. This earnings release slide presentation will also be available on the Company’s website, www.spfi.bank, under the “News & Events” section.
In accordance with General Instruction B.2 of Form 8-K, the information in Item 2.02 and 7.01 of this Current Report on Form 8-K, including Exhibit 99.1 and Exhibit 99.2 hereto, shall not be
deemed “filed” for the purposes of Section 18 of the Securities Exchange Act of 1934, as amended (the “Exchange Act”), or otherwise subject to the liabilities of that section. The information in Item 2.02 and 7.01 of this Current Report on Form
8-K, including Exhibit 99.1 and Exhibit 99.2 hereto, shall not be incorporated by reference into any filing or other document pursuant to the Exchange Act or the Securities Act of 1933, as amended, except as shall be expressly set forth by
specific reference in such filing or document.
| Item 9.01 |
Financial Statements and Exhibits.
|
| (d) |
Exhibits.
|
| 99.1 |
Press release, dated January 27, 2022, announcing fourth quarter and year-end 2021 financial results of South Plains Financial, Inc.
|
| 99.2 |
Earnings release slide presentation, dated January 27, 2022.
|
| 104 |
Cover Page Interactive Data File (formatted as Inline XBRL).
|
SIGNATURES
Pursuant to the requirements of the Securities Exchange Act of 1934, the registrant has duly caused this report to be signed on its behalf by the undersigned hereunto duly authorized.
|
SOUTH PLAINS FINANCIAL, INC.
|
||
|
Dated: January 27, 2022
|
By:
|
/s/ Steven B. Crockett
|
|
Steven B. Crockett
|
|
|
Chief Financial Officer and Treasurer
|
Exhibit 99.1

South Plains Financial, Inc. Reports Fourth Quarter and Year-End 2021 Financial Results
LUBBOCK, Texas, January 27, 2022 (GLOBE NEWSWIRE) – South Plains Financial, Inc. (NASDAQ:SPFI) (“South Plains” or the “Company”), the parent company of City Bank (“City Bank” or the “Bank”),
today reported its financial results for the quarter and year ended December 31, 2021.
Fourth Quarter 2021 Highlights
| ● |
Net income for the fourth quarter of 2021 was $14.6 million, compared to $15.2 million for the third quarter of 2021 and $15.9 million for the fourth quarter of 2020.
|
| ● |
Diluted earnings per share for the fourth quarter of 2021 was $0.79, compared to $0.82 for the third quarter of 2021 and $0.87 for the fourth quarter of 2020.
|
| ● |
Pre-tax, pre-provision income (non-GAAP) for the fourth quarter of 2021 was $18.2 million, compared to $18.9 million for the third quarter of 2021 and $20.0 million for the fourth quarter of 2020.
|
| ● |
Average cost of deposits for the fourth quarter of 2021 decreased to 23 basis points, compared to 25 basis points for the third quarter of 2021 and 31 basis points for the fourth quarter of 2020.
|
| ● |
Nonperforming assets to total assets were 0.30% at December 31, 2021, compared to 0.32% at September 30, 2021 and 0.45% at December 31, 2020.
|
| ● |
Return on average assets for the fourth quarter of 2021 was 1.50% annualized, compared to 1.61% annualized for the third quarter of 2021 and 1.76% annualized for the fourth quarter of 2020.
|
Full Year 2021 Highlights
| ● |
Total assets were $3.9 billion at December 31, 2021, compared to $3.6 billion at December 31, 2020.
|
| ● |
Full year net income of $58.6 million in 2021, compared to $45.4 million in 2020.
|
| ● |
Diluted earnings per share of $3.17 in 2021, compared to $2.47 in 2020.
|
| ● |
Loans held for investment grew $216.0 million, or 9.7%, during 2021.
|
| ● |
Efficiency ratio of 67.1% in 2021, compared to 63.0% in 2020.
|
| ● |
Tangible book value (non-GAAP) per share of $21.51 at December 31, 2021, compared to $18.97 at December 31, 2020.
|
| ● |
Return on average assets of 1.56% for the full year 2021, compared to 1.31% for 2020.
|
Curtis Griffith, South Plains’ Chairman and Chief Executive Officer, commented, “Looking back on 2021, we believe our team delivered another year of strong financial results highlighted by 9.7% organic loan growth,
year over year, which exceeded our goal of mid-single digit growth. Strength in our local Texas markets combined with the successful execution of our plan to grow our lending team contributed to these results. Importantly, we are approximately
halfway to our goal of adding 20 new lenders to our 60-lender team and remain pleased with the quality of bankers that we continue to recruit and hire. This provides us with confidence in our ability to maintain mid to high single-digit loan growth
in 2022 as we work to deploy our excess liquidity into attractive yielding organic loans. As we unlock the latent earnings power on our balance sheet, we believe that we will begin to offset the expected decline in our mortgage banking revenues, as
we work to deliver sustained earnings and book value growth. That said, we will remain disciplined on credit quality as we grow the Company and remain very pleased with the performance of our enterprise risk management system, which has enabled our
team to effectively manage the credit of our loan portfolio through the pandemic.”
Results of Operations, Quarter Ended December 31, 2021
Net Interest Income
Net interest income was $31.4 million for the fourth quarter of 2021, compared to $31.2 million for the third quarter of 2021 and $30.4 million for the fourth quarter of 2020. Net interest
margin, calculated on a tax-equivalent basis, was 3.50% for the fourth quarter of 2021, compared to 3.58% for the third quarter of 2021 and 3.64% for the fourth quarter of 2020. The average yield on loans was 4.90% for the fourth quarter of 2021,
compared to 4.99% for the third quarter of 2021 and 5.10% for the fourth quarter of 2020. The average cost of deposits was 23 basis points for the fourth quarter of 2021, representing a two basis point decrease from the third quarter of 2021 and an
8 basis point decrease from the fourth quarter of 2020.
Interest income was $34.6 million for the fourth quarter of 2021, compared to $34.4 million for the third quarter of 2021 and $34.0 million for the fourth quarter of 2020. Interest income
increased $162 thousand in the fourth quarter of 2021 from the third quarter of 2021 due primarily to an increase of $264 thousand in loan interest income as a result of the growth of $66.1 million in average loans outstanding, partially offset by
a decrease of 9 basis points in the yield on loans, during the fourth quarter of 2021. Further, there was approximately four basis points of yield from several large loan payoffs during the fourth quarter of 2021. In the fourth quarter of 2021,
interest and fees on Small Business Administration (“SBA”) Paycheck Protection Program (“PPP”) loans declined $729 thousand compared to the third quarter of 2021, as the average balance of PPP loans outstanding decreased $38.6 million during the
fourth quarter of 2021 due to PPP loan forgiveness payments received from the SBA during the quarter. Interest income increased $616 thousand in the fourth quarter of 2021 compared to the fourth quarter of 2020, mainly as a result that average
loans outstanding were $165.8 million higher, partially offset by a reduction of 20 basis points in the related yield and a decrease of $1.3 million in PPP-related interest and fees in the fourth quarter of 2021. During the fourth quarter of 2021,
the Company recognized $1.0 million in deferred PPP-related SBA fees. At December 31, 2021, the Company had $1.9 million of deferred PPP fees that have not been accreted to income, the majority of which are expected to be recognized as PPP loans
continue to be forgiven by the SBA over the next several quarters.
Interest expense was $3.2 million for the fourth quarter of 2021, compared to $3.3 million for the third quarter of 2021 and $3.6 million for the fourth quarter of 2020. Interest expense declined
3.3% compared to the third quarter of 2021 as a result of a reduction in interest rates on interest-bearing deposits, partially offset by a higher average balance of these deposits during the quarter. Interest expense decreased $468 thousand
compared to the fourth quarter of 2020, with a reduction of 10 basis points in interest rates on interest-bearing deposits partially offset by an increase of $157.1 million in average interest-bearing deposits.
Noninterest Income and Noninterest Expense
Noninterest income was $22.9 million for the fourth quarter of 2021, compared to $25.8 million for the third quarter of 2021 and $26.2 million for the fourth quarter of 2020. The decline from the
third quarter of 2021 was primarily due to a decrease of $2.4 million in mortgage banking activities revenue and the seasonal decrease of $1.6 million in income from insurance activities. The decrease in mortgage banking revenues was mainly the
result of a reduction of $60.1 million in mortgage loan originations. These decreases were partially offset by an increase in bank card services and interchange fees of $434 thousand during the fourth quarter of 2021, primarily from receiving an
incentive bonus related to volume on the Company’s debit card transactions. Additionally, there was a gain on sale of real estate of $579 thousand in the fourth quarter of 2021 resulting from the sale of land that was held for future expansion. The
decrease in noninterest income for the fourth quarter of 2021 as compared to the fourth quarter of 2020 was primarily due to a decline of $4.5 million in mortgage banking activities revenue as a result of a reduction of $143.6 million in mortgage
loan originations. This decrease was partially offset by the increases in bank card services and interchange fees and gain on sale as noted above.
Noninterest expense was $36.1 million for the fourth quarter of 2021, compared to $38.1 million for the third quarter of 2021 and $36.5 million for the fourth quarter of 2020. The decline from
the third quarter of 2021 was primarily the result of a decrease of $2.6 million in personnel expense due to the seasonal decline of $1.1 million in commissions expense on insurance activities and a reduction of $854 thousand in mortgage
commissions related to the decline in mortgage loan originations. Partially offsetting these declines was an $881 thousand increase in professional services from the third quarter of 2021. This increase primarily relates to $386 thousand invested
in planning the Company’s transition of computing and data storage to the cloud as well as further development of the new customer lead generation initiative and an increase of $274,000 in legal expense. The decrease in noninterest expense for the
fourth quarter of 2021 as compared to the fourth quarter of 2020 was primarily driven by a $1.6 million decrease in personnel expense as mortgage commissions were $2.1 million lower, based on the reduction in mortgage loan originations, partially
offset by personnel costs reflective of the Company’s stated initiative of growing its loan officer capacity. Also, professional services expense increased $657 thousand primarily as noted above.
Loan Portfolio and Composition
Loans held for investment were $2.44 billion as of December 31, 2021, compared to $2.43 billion as of September 30, 2021 and $2.22 billion as of December 31, 2020. The $8.5 million, or 0.4%,
increase during the fourth quarter of 2021 as compared to the third quarter of 2021 was primarily the result of organic net loan growth of $30.5 million, partially offset by a decrease due to SBA forgiveness and repayments of $22.0 million in PPP
loans during the fourth quarter of 2021. The organic loan growth remained relationship-focused and occurred in a majority of loan segments, with the largest volume growth in commercial land development loans, commercial retail loans, and direct
energy loans. Additionally, there was a $16.5 million reduction in hotel loans, primarily from the early payoff of two credits, and a $10.3 million payoff of a classified commercial credit during the fourth quarter of 2021. As of December 31, 2021,
loans held for investment increased $216.0 million, or 9.7%, from December 31, 2020, attributable to organic loan growth experienced in each quarter of 2021, partially offset by SBA forgiveness or repayments, net of originations, of $129.8 million
on PPP loans.
Agricultural production loans were $103.0 million as of December 31, 2021, compared to $119.3 million as of September 30, 2021 and $105.9 million as of December 31, 2020. The decrease of $16.4
million from the third quarter of 2021 is due to typical seasonal repayments of these agricultural production loans.
Deposits and Borrowings
Deposits totaled $3.34 billion as of December 31, 2021, compared to $3.21 billion as of September 30, 2021 and $2.97 billion as of December 31, 2020. Deposits increased by $129.0 million, or
4.0%, in the fourth quarter of 2021 from September 30, 2021, with a majority of the increase relating to personal accounts. As of December 31, 2021, deposits increased $366.9 million, or 12.3%, from December 31, 2020. The increase in deposits since
December 31, 2020 is primarily a result of organic growth as well as existing customers depositing funds received from PPP loan advances, stimulus checks, and generally maintaining higher liquidity in response to the ongoing COVID-19 pandemic.
Noninterest-bearing deposits were $1.07 billion as of December 31, 2021, compared to $1.05 billion as of September 30, 2021 and $917.3 million as of December 31, 2020. Noninterest-bearing
deposits represented 32.1% of total deposits as of December 31, 2021. The change in noninterest-bearing deposit balances at December 31, 2021 compared to September 30, 2021 was an increase of $17.1 million, or 1.6%. The change in
noninterest-bearing deposit balances at December 31, 2021 compared to December 31, 2020 was an increase of $154.0 million, or 16.8%. The changes from both compared periods is primarily a result of organic growth as well as existing customers
increasing their deposit balances.
Asset Quality
As part of the Bank’s efforts to support its customers and protect the Bank in response to the COVID-19 pandemic, the Bank has provided borrowers impacted by the COVID-19 pandemic with relief by
offering varying forms of loan modifications including 90-day payment deferrals, 6-month interest only terms, or in certain select cases periods of longer than 6 months of interest only terms. As of December 31, 2021, there were three total active
loan modifications attributed to the COVID-19 pandemic totaling $15.9 million, or 0.7% of the Company’s loan portfolio. All of these active modified loans at December 31, 2021 are in the hotel portfolio and have original modified terms that
extended up to 18 months. We expect that these remaining modified loans will return to full payment status at the end of their respective modification periods.
The Company did not record a provision for loan losses in the fourth quarter of 2021 or in the third quarter of 2021, compared to a provision for loan losses of $141 thousand for the fourth
quarter of 2020. The Company experienced continued growth in the non-PPP loan portfolio while classified loans decreased by $20.3 million in the fourth quarter of 2021 and annualized net charge-offs increased eight basis points in the fourth
quarter of 2021. As a result, the Company determined that no adjustment to the allowance for loan losses was necessary in the fourth quarter of 2021. There is continued uncertainty from the ongoing COVID-19 pandemic (and any current or future
variants thereof) and the full extent of the impact on the economy and the Company’s customers remains unknown at this time. Accordingly, additional or reversal of provisions for loan losses may be necessary in future periods.
The ratio of allowance for loan losses to loans held for investment was 1.73% as of December 31, 2021, compared to 1.76% as of September 30, 2021 and 2.05% as of December 31, 2020. The ratio of
allowance for loan losses to non-PPP loans held for investment was 1.76% as of December 31, 2021.
The ratio of nonperforming assets to total assets as of December 31, 2021 was 0.30%, compared to 0.32% as of September 30, 2021 and 0.45% at December 31, 2020. Annualized net charge-offs were
0.11% for the fourth quarter of 2021, compared to 0.03% for the third quarter of 2021 and 0.11% for the fourth quarter of 2020.
Conference Call
South Plains will host a conference call to discuss its fourth quarter and year-end 2021 financial results today, January 27, 2022, at 5:00 p.m., Eastern Time. Investors and analysts interested
in participating in the call are invited to dial 1-877-407-9716 (international callers please dial 1-201-493-6779) approximately 10 minutes prior to the start of the call. A live audio webcast of the conference call and conference materials will be
available on the Company’s website at https://www.spfi.bank/news-events/events.
A replay of the conference call will be available within two hours of the conclusion of the call and can be accessed on the investor section of the Company’s website as well as by dialing
1-844-512-2921 (international callers please dial 1-412-317-6671). The pin to access the telephone replay is 13726192. The replay will be available until February 10, 2022.
About South Plains Financial, Inc.
South Plains is the bank holding company for City Bank, a Texas state-chartered bank headquartered in Lubbock, Texas. City Bank is one of the largest independent banks in West Texas and has
additional banking operations in the Dallas, El Paso, Greater Houston, the Permian Basin, and College Station, Texas markets, and the Ruidoso, New Mexico market. South Plains provides a wide range of commercial and consumer financial services to
small and medium-sized businesses and individuals in its market areas. Its principal business activities include commercial and retail banking, along with insurance, investment, trust and mortgage services. Please visit https://www.spfi.bank
for more information.
Non-GAAP Financial Measures
Some of the financial measures included in this press release are not measures of financial performance recognized in accordance with generally accepted accounting principles in the United States
(“GAAP”). These non-GAAP financial measures include Tangible Book Value Per Common Share, Tangible Common Equity to Tangible Assets, and Pre-Tax, Pre-Provision Income. The Company believes these non-GAAP financial measures provide both management
and investors a more complete understanding of the Company’s financial position and performance. These non-GAAP financial measures are supplemental and are not a substitute for any analysis based on GAAP financial measures.
We classify a financial measure as being a non-GAAP financial measure if that financial measure excludes or includes amounts, or is subject to adjustments that have the effect of excluding or
including amounts, that are included or excluded, as the case may be, in the most directly comparable measure calculated and presented in accordance with GAAP as in effect from time to time in the United States in our statements of income, balance
sheets or statements of cash flows. Not all companies use the same calculation of these measures; therefore, this presentation may not be comparable to other similarly titled measures as presented by other companies.
A reconciliation of non-GAAP financial measures to GAAP financial measures is provided at the end of this press release.
Available Information
The Company routinely posts important information for investors on its web site (under www.spfi.bank and, more specifically, under the News &
Events tab at www.spfi.bank/news-events/press-releases). The Company intends to use its web site as a means of disclosing material non-public information and for complying with its disclosure obligations under Regulation FD (Fair
Disclosure) promulgated by the U.S. Securities and Exchange Commission (the “SEC”). Accordingly, investors should monitor the Company’s web site, in addition to following the Company’s press releases, SEC filings, public conference calls,
presentations and webcasts.
The information contained on, or that may be accessed through, the Company’s web site is not incorporated by reference into, and is not a part of, this document.
Forward Looking Statements
This press release contains forward-looking statements within the meaning of the Private Securities Litigation Reform Act of 1995. These forward-looking statements reflect South Plains’ current
views with respect to, among other things, the ongoing COVID-19 pandemic and other future events. Any statements about South Plains’ expectations, beliefs, plans, predictions, forecasts, objectives, assumptions or future events or performance are
not historical facts and may be forward-looking. These statements are often, but not always, made through the use of words or phrases such as “anticipate,” “believes,” “can,” “could,” “may,” “predicts,” “potential,” “should,” “will,” “estimate,”
“plans,” “projects,” “continuing,” “ongoing,” “expects,” “intends” and similar words or phrases. South Plains cautions that the forward-looking statements in this press release are based largely on South Plains’ expectations and are subject to a
number of known and unknown risks and uncertainties that are subject to change based on factors which are, in many instances, beyond South Plains’ control. Factors that could cause such changes include, but are not limited to, general economic
conditions, the extent of the impact of the COVID-19 pandemic (and any current or future variants thereof) on our customers, changes in interest rates, regulatory considerations, competition and market expansion opportunities, changes in
non-interest expenditures or in the anticipated benefits of such expenditures, and changes in applicable laws and regulations. Additional information regarding these risks and uncertainties to which South Plains’ business and future financial
performance are subject is contained in South Plains’ most recent Annual Report on Form 10-K and Quarterly Reports on Form 10-Q on file with the SEC, and other documents South Plains files with the SEC from time to time. South Plains urges readers
of this press release to review the “Risk Factors” section of our most recent Annual Report on Form 10-K, as well as the “Risk Factors” section of other documents
South Plains files or furnishes with the SEC from time to time, which are available on the SEC’s website, www.sec.gov. Actual results, performance or achievements could differ materially from those contemplated, expressed, or implied by the
forward-looking statements due to additional risks and uncertainties of which South Plains is not currently aware or which it does not currently view as, but in the future may become, material to its business or operating results. Due to these and
other possible uncertainties and risks, the Company can give no assurance that the results contemplated in the forward-looking statements will be realized and readers are cautioned not to place undue reliance on the forward-looking statements
contained in this press release. Any forward-looking statements presented herein are made only as of the date of this press release, and South Plains does not undertake any obligation to update or revise any forward-looking statements to reflect
changes in assumptions, new information, the occurrence of unanticipated events, or otherwise, except as required by law. All forward-looking statements, express or implied, included in the press release are qualified in their entirety by this
cautionary statement.
|
Contact:
|
Mikella Newsom, Chief Risk Officer and Secretary
|
|
(866) 771-3347
|
|
Source: South Plains Financial, Inc.
South Plains Financial, Inc.
Consolidated Financial Highlights - (Unaudited)
(Dollars in thousands, except share data)
|
As of and for the quarter ended
|
||||||||||||||||||||
|
December 31,
2021
|
September 30,
2021
|
June 30,
2021
|
March 31,
2021
|
December 31,
2020
|
||||||||||||||||
|
Selected Income Statement Data:
|
||||||||||||||||||||
|
Interest income
|
$
|
34,600
|
$
|
34,438
|
$
|
33,016
|
$
|
32,982
|
$
|
33,984
|
||||||||||
|
Interest expense
|
3,151
|
3,260
|
3,423
|
3,438
|
3,619
|
|||||||||||||||
|
Net interest income
|
31,449
|
31,178
|
29,593
|
29,544
|
30,365
|
|||||||||||||||
|
Provision for loan losses
|
-
|
-
|
(2,007
|
)
|
89
|
141
|
||||||||||||||
|
Noninterest income
|
22,928
|
25,791
|
22,250
|
26,500
|
26,172
|
|||||||||||||||
|
Noninterest expense
|
36,132
|
38,063
|
36,778
|
37,057
|
36,504
|
|||||||||||||||
|
Income tax expense
|
3,631
|
3,716
|
3,422
|
3,738
|
3,968
|
|||||||||||||||
|
Net income
|
14,614
|
15,190
|
13,650
|
15,160
|
15,924
|
|||||||||||||||
|
Per Share Data (Common Stock):
|
||||||||||||||||||||
|
Net earnings, basic
|
0.82
|
0.85
|
0.76
|
0.84
|
0.88
|
|||||||||||||||
|
Net earnings, diluted
|
0.79
|
0.82
|
0.74
|
0.82
|
0.87
|
|||||||||||||||
|
Cash dividends declared and paid
|
0.09
|
0.09
|
0.07
|
0.05
|
0.05
|
|||||||||||||||
|
Book value
|
22.94
|
22.34
|
21.81
|
20.75
|
20.47
|
|||||||||||||||
|
Tangible book value (non-GAAP)
|
21.51
|
20.90
|
20.35
|
19.28
|
18.97
|
|||||||||||||||
|
Weighted average shares outstanding, basic
|
17,777,542
|
17,931,174
|
18,039,553
|
18,069,186
|
18,053,467
|
|||||||||||||||
|
Weighted average shares outstanding, dilutive
|
18,433,038
|
18,463,697
|
18,553,050
|
18,511,120
|
18,366,129
|
|||||||||||||||
|
Shares outstanding at end of period
|
17,760,243
|
17,824,094
|
18,014,398
|
18,053,229
|
18,076,364
|
|||||||||||||||
|
Selected Period End Balance Sheet Data:
|
||||||||||||||||||||
|
Cash and cash equivalents
|
486,821
|
327,600
|
383,949
|
413,406
|
300,307
|
|||||||||||||||
|
Investment securities
|
724,504
|
752,562
|
777,613
|
777,208
|
803,087
|
|||||||||||||||
|
Total loans held for investment
|
2,437,577
|
2,429,041
|
2,303,462
|
2,242,676
|
2,221,583
|
|||||||||||||||
|
Allowance for loan losses
|
42,098
|
42,768
|
42,963
|
45,019
|
45,553
|
|||||||||||||||
|
Total assets
|
3,901,855
|
3,774,175
|
3,712,915
|
3,732,894
|
3,599,160
|
|||||||||||||||
|
Interest-bearing deposits
|
2,269,855
|
2,157,981
|
2,159,554
|
2,193,427
|
2,057,029
|
|||||||||||||||
|
Noninterest-bearing deposits
|
1,071,367
|
1,054,264
|
998,941
|
962,205
|
917,322
|
|||||||||||||||
|
Total deposits
|
3,341,222
|
3,212,245
|
3,158,495
|
3,155,632
|
2,974,351
|
|||||||||||||||
|
Borrowings
|
122,168
|
122,121
|
125,965
|
164,553
|
223,532
|
|||||||||||||||
|
Total stockholders’ equity
|
407,427
|
398,276
|
392,815
|
374,671
|
370,048
|
|||||||||||||||
|
Summary Performance Ratios:
|
||||||||||||||||||||
|
Return on average assets
|
1.50
|
%
|
1.61
|
%
|
1.46
|
%
|
1.66
|
%
|
1.76
|
%
|
||||||||||
|
Return on average equity
|
14.39
|
%
|
15.24
|
%
|
14.27
|
%
|
16.51
|
%
|
17.53
|
%
|
||||||||||
|
Net interest margin (1)
|
3.50
|
%
|
3.58
|
%
|
3.42
|
%
|
3.52
|
%
|
3.64
|
%
|
||||||||||
|
Yield on loans
|
4.90
|
%
|
4.99
|
%
|
4.97
|
%
|
5.07
|
%
|
5.10
|
%
|
||||||||||
|
Cost of interest-bearing deposits
|
0.35
|
%
|
0.37
|
%
|
0.40
|
%
|
0.41
|
%
|
0.45
|
%
|
||||||||||
|
Efficiency ratio
|
66.07
|
%
|
66.45
|
%
|
70.52
|
%
|
65.76
|
%
|
64.19
|
%
|
||||||||||
|
Summary Credit Quality Data:
|
||||||||||||||||||||
|
Nonperforming loans
|
10,598
|
10,895
|
12,538
|
14,316
|
14,964
|
|||||||||||||||
|
Nonperforming loans to total loans held for investment
|
0.43
|
%
|
0.45
|
%
|
0.54
|
%
|
0.64
|
%
|
0.67
|
%
|
||||||||||
|
Other real estate owned
|
1,032
|
1,081
|
1,146
|
1,377
|
1,353
|
|||||||||||||||
|
Nonperforming assets to total assets
|
0.30
|
%
|
0.32
|
%
|
0.37
|
%
|
0.42
|
%
|
0.45
|
%
|
||||||||||
|
Allowance for loan losses to total loans held for investment
|
1.73
|
%
|
1.76
|
%
|
1.87
|
%
|
2.01
|
%
|
2.05
|
%
|
||||||||||
|
Net charge-offs to average loans outstanding (annualized)
|
0.11
|
%
|
0.03
|
%
|
0.01
|
%
|
0.11
|
%
|
0.11
|
%
|
||||||||||
|
As of and for the quarter ended
|
||||||||||||||||||||
|
December 31
2021
|
September 30,
2021
|
June 30,
2021
|
March 31,
2021
|
December 31,
2020
|
||||||||||||||||
|
Capital Ratios:
|
||||||||||||||||||||
|
Total stockholders’ equity to total assets
|
10.44
|
%
|
10.55
|
%
|
10.58
|
%
|
10.04
|
%
|
10.28
|
%
|
||||||||||
|
Tangible common equity to tangible assets (non-GAAP)
|
9.85
|
%
|
9.94
|
%
|
9.94
|
%
|
9.39
|
%
|
9.60
|
%
|
||||||||||
|
Common equity tier 1 to risk-weighted assets
|
12.91
|
%
|
12.68
|
%
|
13.14
|
%
|
13.23
|
%
|
12.96
|
%
|
||||||||||
|
Tier 1 capital to average assets
|
10.77
|
%
|
10.83
|
%
|
10.54
|
%
|
10.35
|
%
|
10.24
|
%
|
||||||||||
|
Total capital to risk-weighted assets
|
18.40
|
%
|
18.21
|
%
|
18.95
|
%
|
19.24
|
%
|
19.08
|
%
|
||||||||||
| (1) |
Net interest margin is calculated as the annual net interest income, on a fully tax-equivalent basis, divided by average interest-earning assets.
|
South Plains Financial, Inc.
Average Balances and Yields - (Unaudited)
(Dollars in thousands)
|
For the Three Months Ended
|
||||||||||||||||||||||||
|
December 31, 2021
|
December 31, 2020
|
|||||||||||||||||||||||
|
Average
Balance
|
Interest
Income
Expense
|
Yield
|
Average
Balance
|
Interest
Income
Expense
|
Yield
|
|||||||||||||||||||
|
Assets
|
||||||||||||||||||||||||
|
Loans, excluding PPP (1)
|
$
|
2,469,703
|
$
|
29,940
|
4.81
|
%
|
$
|
2,157,510
|
$
|
27,712
|
5.11
|
%
|
||||||||||||
|
Loans - PPP
|
48,033
|
1,143
|
9.44
|
%
|
194,413
|
2,452
|
5.02
|
%
|
||||||||||||||||
|
Debt securities - taxable
|
507,948
|
2,174
|
1.70
|
%
|
554,480
|
2,567
|
1.84
|
%
|
||||||||||||||||
|
Debt securities - nontaxable
|
219,812
|
1,458
|
2.63
|
%
|
207,453
|
1,452
|
2.78
|
%
|
||||||||||||||||
|
Other interest-bearing assets
|
359,088
|
192
|
0.21
|
%
|
242,241
|
137
|
0.22
|
%
|
||||||||||||||||
|
Total interest-earning assets
|
3,604,584
|
34,907
|
3.84
|
%
|
3,356,097
|
34,320
|
4.07
|
%
|
||||||||||||||||
|
Noninterest-earning assets
|
260,211
|
252,574
|
||||||||||||||||||||||
|
Total assets
|
$
|
3,864,795
|
$
|
3,608,671
|
||||||||||||||||||||
|
Liabilities & stockholders’ equity
|
||||||||||||||||||||||||
|
NOW, Savings, MMA’s
|
$
|
1,864,373
|
904
|
0.19
|
%
|
$
|
1,720,778
|
1,138
|
0.26
|
%
|
||||||||||||||
|
Time deposits
|
337,449
|
1,016
|
1.19
|
%
|
323,921
|
1,196
|
1.47
|
%
|
||||||||||||||||
|
Short-term borrowings
|
4
|
-
|
0.00
|
%
|
18,344
|
2
|
0.04
|
%
|
||||||||||||||||
|
Notes payable & other long-term borrowings
|
-
|
-
|
0.00
|
%
|
75,000
|
40
|
0.21
|
%
|
||||||||||||||||
|
Subordinated debt securities
|
75,752
|
1,012
|
5.30
|
%
|
75,572
|
1,013
|
5.33
|
%
|
||||||||||||||||
|
Junior subordinated deferrable interest debentures
|
46,393
|
219
|
1.87
|
%
|
46,393
|
230
|
1.97
|
%
|
||||||||||||||||
|
Total interest-bearing liabilities
|
2,323,971
|
3,151
|
0.54
|
%
|
2,260,008
|
3,619
|
0.64
|
%
|
||||||||||||||||
|
Demand deposits
|
1,093,352
|
942,799
|
||||||||||||||||||||||
|
Other liabilities
|
44,620
|
44,556
|
||||||||||||||||||||||
|
Stockholders’ equity
|
402,852
|
361,308
|
||||||||||||||||||||||
|
Total liabilities & stockholders’ equity
|
$
|
3,864,795
|
$
|
3,608,671
|
||||||||||||||||||||
|
Net interest income
|
$
|
31,756
|
$
|
30,701
|
||||||||||||||||||||
|
Net interest margin (2)
|
3.50
|
%
|
3.64
|
%
|
||||||||||||||||||||
| (1) |
Average loan balances include nonaccrual loans and loans held for sale.
|
| (2) |
Net interest margin is calculated as the annualized net income, on a fully tax-equivalent basis, divided by average interest-earning assets.
|
South Plains Financial, Inc.
Average Balances and Yields - (Unaudited)
(Dollars in thousands)
|
For the Twelve Months Ended
|
||||||||||||||||||||||||
|
December 31, 2021
|
December 31, 2020
|
|||||||||||||||||||||||
|
Average
Balance
|
Interest
Income
Expense
|
Yield
|
Average
Balance
|
Interest
Income
Expense
|
Yield
|
|||||||||||||||||||
|
Assets
|
||||||||||||||||||||||||
|
Loans, excluding PPP (1)
|
$
|
2,302,413
|
$
|
112,255
|
4.88
|
%
|
$
|
2,181,118
|
$
|
116,753
|
5.35
|
%
|
||||||||||||
|
Loans - PPP
|
117,788
|
8,290
|
7.04
|
%
|
144,514
|
5,130
|
3.55
|
%
|
||||||||||||||||
|
Debt securities - taxable
|
532,272
|
9,292
|
1.75
|
%
|
547,107
|
11,852
|
2.17
|
%
|
||||||||||||||||
|
Debt securities - nontaxable
|
219,385
|
5,872
|
2.68
|
%
|
158,482
|
4,489
|
2.83
|
%
|
||||||||||||||||
|
Other interest-bearing assets
|
336,081
|
565
|
0.17
|
%
|
184,262
|
1,100
|
0.60
|
%
|
||||||||||||||||
|
Total interest-earning assets
|
3,507,939
|
136,274
|
3.88
|
%
|
3,215,483
|
139,324
|
4.33
|
%
|
||||||||||||||||
|
Noninterest-earning assets
|
261,140
|
249,536
|
||||||||||||||||||||||
|
Total assets
|
$
|
3,769,079
|
$
|
3,465,019
|
||||||||||||||||||||
|
Liabilities & stockholders’ equity
|
||||||||||||||||||||||||
|
NOW, Savings, MMA’s
|
$
|
1,841,678
|
4,163
|
0.23
|
%
|
$
|
1,653,088
|
6,337
|
0.38
|
%
|
||||||||||||||
|
Time deposits
|
329,509
|
4,130
|
1.25
|
%
|
331,623
|
5,557
|
1.68
|
%
|
||||||||||||||||
|
Short-term borrowings
|
8,045
|
5
|
0.06
|
%
|
19,404
|
104
|
0.54
|
%
|
||||||||||||||||
|
Notes payable & other long-term borrowings
|
19,641
|
38
|
0.19
|
%
|
107,045
|
558
|
0.52
|
%
|
||||||||||||||||
|
Subordinated debt securities
|
75,699
|
4,056
|
5.36
|
%
|
38,747
|
2,223
|
5.74
|
%
|
||||||||||||||||
|
Junior subordinated deferrable interest debentures
|
46,393
|
880
|
1.90
|
%
|
46,393
|
1,167
|
2.52
|
%
|
||||||||||||||||
|
Total interest-bearing liabilities
|
2,320,965
|
13,272
|
0.57
|
%
|
2,196,300
|
15,946
|
0.73
|
%
|
||||||||||||||||
|
Demand deposits
|
1,016,835
|
888,653
|
||||||||||||||||||||||
|
Other liabilities
|
42,654
|
41,573
|
||||||||||||||||||||||
|
Stockholders’ equity
|
388,625
|
338,493
|
||||||||||||||||||||||
|
Total liabilities & stockholders’ equity
|
$
|
3,769,079
|
$
|
3,465,019
|
||||||||||||||||||||
|
Net interest income
|
$
|
123,002
|
$
|
123,378
|
||||||||||||||||||||
|
Net interest margin (2)
|
3.51
|
%
|
3.84
|
%
|
||||||||||||||||||||
| (1) |
Average loan balances include nonaccrual loans and loans held for sale.
|
| (2) |
Net interest margin is calculated as the annualized net income, on a fully tax-equivalent basis, divided by average interest-earning assets.
|
South Plains Financial, Inc.
Consolidated Balance Sheets
(Unaudited)
(Dollars in thousands)
|
As of
|
||||||||
|
December 31,
2021
|
December 31,
2020
|
|||||||
|
Assets
|
||||||||
|
Cash and due from banks
|
$
|
68,425
|
$
|
76,146
|
||||
|
Interest-bearing deposits in banks
|
418,396
|
224,161
|
||||||
|
Federal funds sold
|
—
|
—
|
||||||
|
Investment securities
|
724,504
|
803,087
|
||||||
|
Loans held for sale
|
76,507
|
111,477
|
||||||
|
Loans held for investment
|
2,437,577
|
2,221,583
|
||||||
|
Less: Allowance for loan losses
|
(42,098
|
)
|
(45,553
|
)
|
||||
|
Net loans held for investment
|
2,395,479
|
2,176,030
|
||||||
|
Premises and equipment, net
|
57,699
|
60,331
|
||||||
|
Goodwill
|
19,508
|
19,508
|
||||||
|
Intangible assets
|
5,895
|
7,562
|
||||||
|
Mortgage servicing assets
|
19,700
|
9,049
|
||||||
|
Other assets
|
115,742
|
111,809
|
||||||
|
Total assets
|
$
|
3,901,855
|
$
|
3,599,160
|
||||
|
Liabilities and Stockholders’ Equity Liabilities
|
||||||||
|
Noninterest bearing deposits
|
$
|
1,071,367
|
$
|
917,322
|
||||
|
Interest-bearing deposits
|
2,269,855
|
2,057,029
|
||||||
|
Total deposits
|
3,341,222
|
2,974,351
|
||||||
|
Other borrowings
|
-
|
101,550
|
||||||
|
Subordinated debt securities
|
75,775
|
75,589
|
||||||
|
Trust preferred subordinated debentures
|
46,393
|
46,393
|
||||||
|
Other liabilities
|
31,038
|
31,229
|
||||||
|
Total liabilities
|
3,494,428
|
3,229,112
|
||||||
|
Stockholders’ Equity
|
||||||||
|
Common stock
|
17,760
|
18,076
|
||||||
|
Additional paid-in capital
|
133,215
|
141,112
|
||||||
|
Retained earnings
|
242,750
|
189,521
|
||||||
|
Accumulated other comprehensive income (loss)
|
13,702
|
21,339
|
||||||
|
Total stockholders’ equity
|
407,427
|
370,048
|
||||||
|
Total liabilities and stockholders’ equity
|
$
|
3,901,855
|
$
|
3,599,160
|
||||
South Plains Financial, Inc.
Consolidated Statements of Income
(Unaudited)
(Dollars in thousands)
|
Three Months Ended
|
Twelve Months Ended
|
|||||||||||||||
|
December 31,
2021
|
December 31,
2020
|
December 31,
2021
|
December 31,
2020
|
|||||||||||||
|
Interest income:
|
||||||||||||||||
|
Loans, including fees
|
$
|
31,082
|
$
|
30,133
|
$
|
120,540
|
$
|
121,733
|
||||||||
|
Other
|
3,518
|
3,851
|
14,496
|
16,498
|
||||||||||||
|
Total Interest income
|
34,600
|
33,984
|
135,036
|
138,231
|
||||||||||||
|
Interest expense:
|
||||||||||||||||
|
Deposits
|
1,920
|
2,334
|
8,293
|
11,894
|
||||||||||||
|
Subordinated debt securities
|
1,012
|
1,013
|
4,056
|
2,223
|
||||||||||||
|
Trust preferred subordinated debentures
|
219
|
230
|
880
|
1,167
|
||||||||||||
|
Other
|
-
|
42
|
43
|
662
|
||||||||||||
|
Total Interest expense
|
3,151
|
3,619
|
13,272
|
15,946
|
||||||||||||
|
Net interest income
|
31,449
|
30,365
|
121,764
|
122,285
|
||||||||||||
|
Provision for loan losses
|
-
|
141
|
(1,918
|
)
|
25,570
|
|||||||||||
|
Net interest income after provision for loan losses
|
31,449
|
30,224
|
123,682
|
96,715
|
||||||||||||
|
Noninterest income:
|
||||||||||||||||
|
Service charges on deposits
|
1,940
|
1,861
|
6,963
|
7,032
|
||||||||||||
|
Income from insurance activities
|
2,168
|
2,160
|
8,314
|
7,644
|
||||||||||||
|
Mortgage banking activities
|
12,397
|
16,925
|
59,726
|
65,042
|
||||||||||||
|
Bank card services and interchange fees
|
3,479
|
2,845
|
12,239
|
10,035
|
||||||||||||
|
Other
|
2,944
|
2,381
|
10,227
|
9,532
|
||||||||||||
|
Total Noninterest income
|
22,928
|
26,172
|
97,469
|
101,603
|
||||||||||||
|
Noninterest expense:
|
||||||||||||||||
|
Salaries and employee benefits
|
21,549
|
23,117
|
93,360
|
89,220
|
||||||||||||
|
Net occupancy expense
|
3,600
|
3,762
|
14,560
|
14,658
|
||||||||||||
|
Professional services
|
2,269
|
1,612
|
6,752
|
6,322
|
||||||||||||
|
Marketing and development
|
1,068
|
899
|
3,225
|
3,088
|
||||||||||||
|
Other
|
7,646
|
7,114
|
30,133
|
28,427
|
||||||||||||
|
Total noninterest expense
|
36,132
|
36,504
|
148,030
|
141,715
|
||||||||||||
|
Income before income taxes
|
18,245
|
19,892
|
73,121
|
56,603
|
||||||||||||
|
Income tax expense (benefit)
|
3,631
|
3,968
|
14,507
|
11,250
|
||||||||||||
|
Net income
|
$
|
14,614
|
$
|
15,924
|
$
|
58,614
|
$
|
45,353
|
||||||||
South Plains Financial, Inc.
Loan Composition
(Unaudited)
(Dollars in thousands)
|
As of
|
||||||||
|
December 31,
2021
|
December 31,
2020
|
|||||||
|
Loans:
|
||||||||
|
Commercial Real Estate
|
$
|
755,444
|
$
|
663,344
|
||||
|
Commercial - Specialized
|
378,725
|
311,686
|
||||||
|
Commercial - General
|
460,024
|
518,309
|
||||||
|
Consumer:
|
||||||||
|
1-4 Family Residential
|
387,690
|
360,315
|
||||||
|
Auto Loans
|
240,719
|
205,840
|
||||||
|
Other Consumer
|
68,113
|
67,595
|
||||||
|
Construction
|
146,862
|
94,494
|
||||||
|
Total loans held for investment
|
$
|
2,437,577
|
$
|
2,221,583
|
||||
South Plains Financial, Inc.
Deposit Composition
(Unaudited)
(Dollars in thousands)
|
As of
|
||||||||
|
December 31,
2021
|
December 31,
2020
|
|||||||
|
Deposits:
|
||||||||
|
Noninterest-bearing demand deposits
|
$
|
1,071,367
|
$
|
917,322
|
||||
|
NOW & other transaction accounts
|
465,741
|
332,829
|
||||||
|
MMDA & other savings
|
1,464,376
|
1,398,699
|
||||||
|
Time deposits
|
339,738
|
325,501
|
||||||
|
Total deposits
|
$
|
3,341,222
|
$
|
2,974,351
|
||||
South Plains Financial, Inc.
Reconciliation of Non-GAAP Financial Measures (Unaudited)
(Dollars in thousands)
|
As of and for the quarter ended
|
||||||||||||||||||||
|
December 31,
2021
|
September 30,
2021
|
June 30,
2021
|
March 31,
2021
|
December 31,
2020
|
||||||||||||||||
|
Pre-tax, pre-provision income
|
||||||||||||||||||||
|
Net income
|
$
|
14,614
|
$
|
15,190
|
$
|
13,650
|
$
|
15,160
|
$
|
15,924
|
||||||||||
|
Income tax expense
|
3,631
|
3,716
|
3,422
|
3,738
|
3,968
|
|||||||||||||||
|
Provision for loan losses
|
-
|
-
|
(2,007
|
)
|
89
|
141
|
||||||||||||||
|
Pre-tax, pre-provision income
|
$
|
18,245
|
$
|
18,906
|
$
|
15,065
|
$
|
18,987
|
$
|
20,033
|
||||||||||
South Plains Financial, Inc.
Reconciliation of Non-GAAP Financial Measures (Unaudited)
(Dollars in thousands)
|
As of
|
||||||||||||||||||||
|
December 31,
2021
|
September 30,
2021
|
June 30,
2021
|
March 31,
2021
|
December 31,
2020
|
||||||||||||||||
|
Tangible common equity
|
||||||||||||||||||||
|
Total common stockholders’ equity
|
$
|
407,427
|
$
|
398,276
|
$
|
392,815
|
$
|
374,671
|
$
|
370,048
|
||||||||||
|
Less: goodwill and other intangibles
|
(25,403
|
)
|
(25,804
|
)
|
(26,226
|
)
|
(26,648
|
)
|
(27,070
|
)
|
||||||||||
|
Tangible common equity
|
$
|
382,024
|
$
|
372,472
|
$
|
366,589
|
$
|
348,023
|
$
|
342,978
|
||||||||||
|
Tangible assets
|
||||||||||||||||||||
|
Total assets
|
$
|
3,901,855
|
$
|
3,774,175
|
$
|
3,712,915
|
$
|
3,732,894
|
$
|
3,599,160
|
||||||||||
|
Less: goodwill and other intangibles
|
(25,403
|
)
|
(25,804
|
)
|
(26,226
|
)
|
(26,648
|
)
|
(27,070
|
)
|
||||||||||
|
Tangible assets
|
$
|
3,876,452
|
$
|
3,748,371
|
$
|
3,686,689
|
$
|
3,706,246
|
$
|
3,572,090
|
||||||||||
|
Shares outstanding
|
17,760,243
|
17,824,094
|
18,014,398
|
18,053,229
|
18,076,364
|
|||||||||||||||
|
Total stockholders’ equity to total assets
|
10.44
|
%
|
10.55
|
%
|
10.58
|
%
|
10.04
|
%
|
10.28
|
%
|
||||||||||
|
Tangible common equity to tangible assets
|
9.85
|
%
|
9.94
|
%
|
9.94
|
%
|
9.39
|
%
|
9.60
|
%
|
||||||||||
|
Book value per share
|
$
|
22.94
|
$
|
22.34
|
$
|
21.81
|
$
|
20.75
|
$
|
20.47
|
||||||||||
|
Tangible book value per share
|
$
|
21.51
|
$
|
20.90
|
$
|
20.35
|
$
|
19.28
|
$
|
18.97
|
||||||||||
Exhibit 99.2
South Plains Financial Earnings Presentation Fourth Quarter, 2021 1
Safe Harbor Statement and Other Disclosures FORWARD-LOOKING STATEMENTSThis presentation contains, and
future oral and written statements of South Plains Financial, Inc. (“South Plains” or the “Company”) and City Bank (“City Bank” or the “Bank”) may contain, statements about future events that constitute forward-looking statements within the
meaning of the Private Securities Litigation Reform Act of 1995. These forward-looking statements reflect South Plains’ current views with respect to, among other things, the ongoing COVID-19 pandemic, future events and South Plains’
financial performance. Any statements about South Plains’ expectations, beliefs, plans, predictions, forecasts, objectives, assumptions or future events or performance are not historical facts and may be forward-looking. These statements are
often, but not always, made through the use of words or phrases such as “anticipate,” “believes,” “can,” “could,” “may,” “predicts,” “potential,” “should,” “will,” “estimate,” “plans,” “projects,” “continuing,” “ongoing,” “expects,” “intends”
and similar words or phrases. Forward-looking statements include, but are not limited to: (i) projections and estimates of revenues, expenses, income or loss, earnings or loss per share, and other financial items, (ii) statements of plans,
objectives and expectations of South Plains or its management, (iii) statements of future economic performance, and (iv) statements of assumptions underlying such statements. Forward-looking statements should not be relied on because they
involve known and unknown risks, uncertainties and other factors, some of which are beyond the control of South Plains and City Bank. These risks, uncertainties and other factors may cause the actual results, performance, and achievements of
South Plains and City Bank to be materially different from the anticipated future results, performance or achievements expressed in, or implied by, the forward-looking statements. Factors that could cause such differences include, but are not
limited to, local, regional, national and international economic conditions, the extent of the impact of the COVID-19 pandemic (and any current or future variant thereof), including the impact of actions taken by governmental and regulatory
authorities in response to such pandemic, such as the Coronavirus Aid, Relief, and Economic Security Act and subsequent related legislations, and the programs established thereunder, and City Bank’s participation in such programs, volatility
of the financial markets, changes in interest rates, regulatory considerations, competition and market expansion opportunities, changes in non-interest expenditures or in the anticipated benefits of such expenditures, the receipt of required
regulatory approvals, changes in non-performing assets and charge-offs, adequacy of loan loss reserves, changes in tax laws, current or future litigation, regulatory examinations or other legal and/or regulatory actions, the impact of any
tariffs, terrorist threats and attacks, acts of war or threats thereof or other pandemics. Due to these and other possible uncertainties and risks, South Plains can give no assurance that the results contemplated in the forward-looking
statements will be realized and readers are cautioned not to place undue reliance on the forward-looking statements contained in this presentation. For more information about these factors, please see South Plains’ reports filed with or
furnished to the U.S. Securities and Exchange Commission (the “SEC”), including South Plains’ most recent Annual Report on Form 10-K and Quarterly Reports on Form 10-Q on file with the SEC, including the sections entitled "Risk Factors" and
"Management's Discussion and Analysis of Financial Condition and Results of Operations." Further, any forward-looking statement speaks only as of the date on which it is made and South Plains undertakes no obligation to update or revise any
forward-looking statement to reflect events or circumstances after the date on which the statement is made or to reflect the occurrence of unanticipated events, except as required by law. All forward-looking statements, express or implied,
herein are qualified in their entirety by this cautionary statement.NON-GAAP FINANCIAL MEASURESManagement believes that certain non-GAAP performance measures used in this presentation provide meaningful information about underlying trends in
its business and operations. Non-GAAP financial measures should be viewed in addition to, and not as an alternative for, SPFI’s reported results prepared in accordance with GAAP. Numbers in this presentation may not sum due to rounding. 2
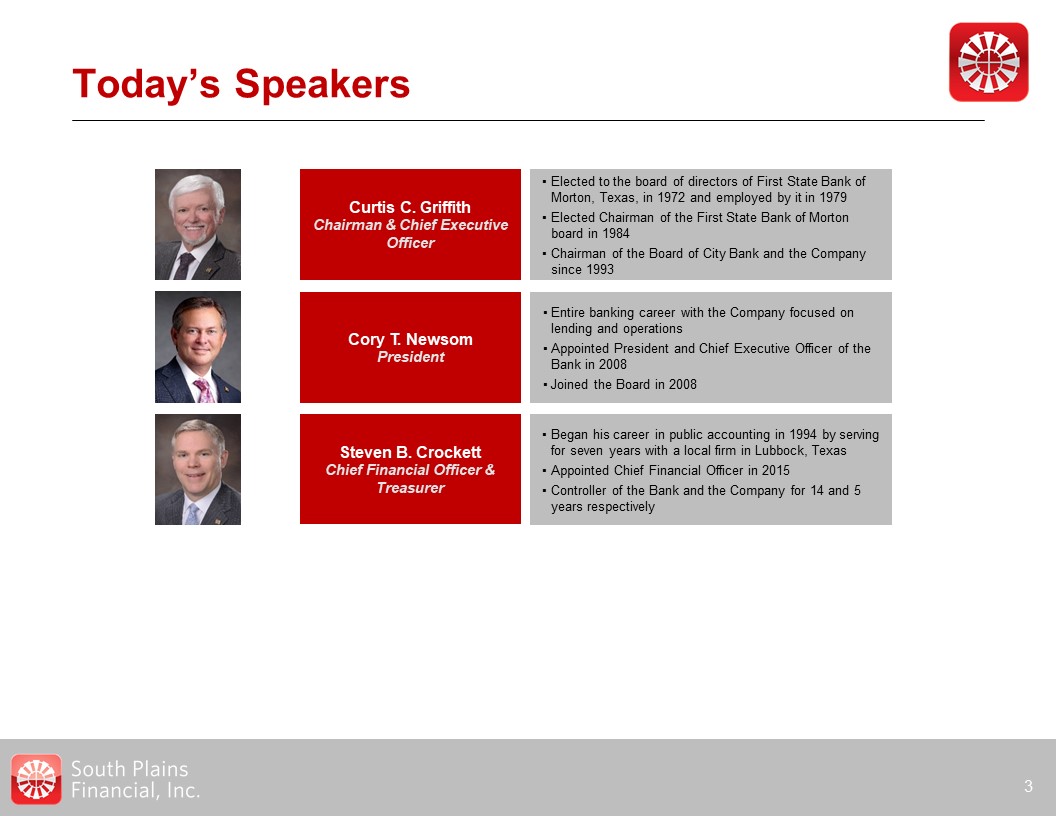
Today’s Speakers 3 Curtis C. GriffithChairman & Chief Executive Officer Elected to the board
of directors of First State Bank of Morton, Texas, in 1972 and employed by it in 1979Elected Chairman of the First State Bank of Morton board in 1984Chairman of the Board of City Bank and the Company since 1993 Steven B. CrockettChief
Financial Officer & Treasurer Began his career in public accounting in 1994 by serving for seven years with a local firm in Lubbock, TexasAppointed Chief Financial Officer in 2015Controller of the Bank and the Company for 14 and 5 years
respectively Cory T. NewsomPresident Entire banking career with the Company focused on lending and operationsAppointed President and Chief Executive Officer of the Bank in 2008Joined the Board in 2008

$3.9 Billion in Total Assets as of December 31, 2021 Parent company of City Bank, a leading
Texas-based community bank headquartered in Lubbock, TX Fourth Quarter and Full Year 2021 Highlights 4 One of the largest independent banks headquartered in West Texas New Mexico Texas Dallas Bryan /College
Station Houston Midland Odessa El Paso Lubbock Ruidoso SanAntonio Ft. Worth Austin Albuquerque Santa Fe City Bank Branch Locations Net income of $14.6 million, compared to $15.2 million in 3Q’21 and $15.9 million in
4Q’20Diluted earnings per share of $0.79, compared to $0.82 in 3Q’21 and $0.87 in 4Q’20Pre-tax, pre-provision income (non-GAAP) of $18.2 million, compared to $18.9 million in 3Q’21 and $20.0 million in 4Q’20Average cost of deposits decreased
to 23 bps, compared to 25 bps in 3Q’21 and 31 bps in 4Q’20Net interest margin, calculated on a tax-equivalent basis, of 3.50%, compared to 3.58% in 3Q’21 and 3.64% in 4Q’20 NASDAQ: SPFI 4Q'21 Highlights Note: Tangible book value per share
is a non-GAAP measures. See appendix for the reconciliation to GAAP Source: Company documents $3.9 billion in total assets, compared to $3.6 billion at 12/31/20Net Income of $58.6 million, compared to $45.4 million in 2020Diluted earnings
per share of $3.17, compared to $2.47 in 2020Loan growth of $216.0 million or 9.7% during 2021Tangible book value per share (non-GAAP) of $21.51, compared to $18.97 at 12/31/20Return on Average Assets of 1.56%, compared to 1.31% in 2020 Full
Year 2021 Highlights

Loan Portfolio 5 4Q’21 Highlights Total loans increased by $8.5 million compared to 3Q’21,
primarily due to:$30.5 million organic net loan growthPartially offset by SBA forgiveness and repayments of $22.0 million in PPP loans Additionally, there were $26.8 million in early payoffs from two hotel loans and a classified commercial
creditStrategic initiative underway to grow SPFI’s banking team by more than 30% over two years with a primary focus on Dallas and Houston markets4Q’21 yield on loans, ex-PPP, of 4.81%; a decrease of 5 bps compared to 3Q’21, excluding PPP
loans Total Loans Held for Investment$ in Millions Source: Company documents

Loan Portfolio 6 Portfolio Composition Loan Portfolio ($ in
millions) 12/31/21 Commercial C&D $ 104.8 Residential C&D 218.3 CRE Owner/Occ. 230.6 Other CRE Non Owner/Occ. 440.8 Multi-Family 138.4 C&I 376.8 Agriculture 191.2 1-4 Family
387.7 Auto 240.7 Other Consumer 68.1 PPP 40.2 Total $ 2,437.6 Source: Company documents Active loan modifications attributed to the COVID-19 pandemic were 0.7%, or $15.9 million, of total loans at December
31, 2021. All of these active modified loans are in the hotel portfolio and have original modified terms that extended up to 18 months. We expect that these remaining modified loans will return to full payment status at the end of their
respective modification periods. 4Q’21 Highlights
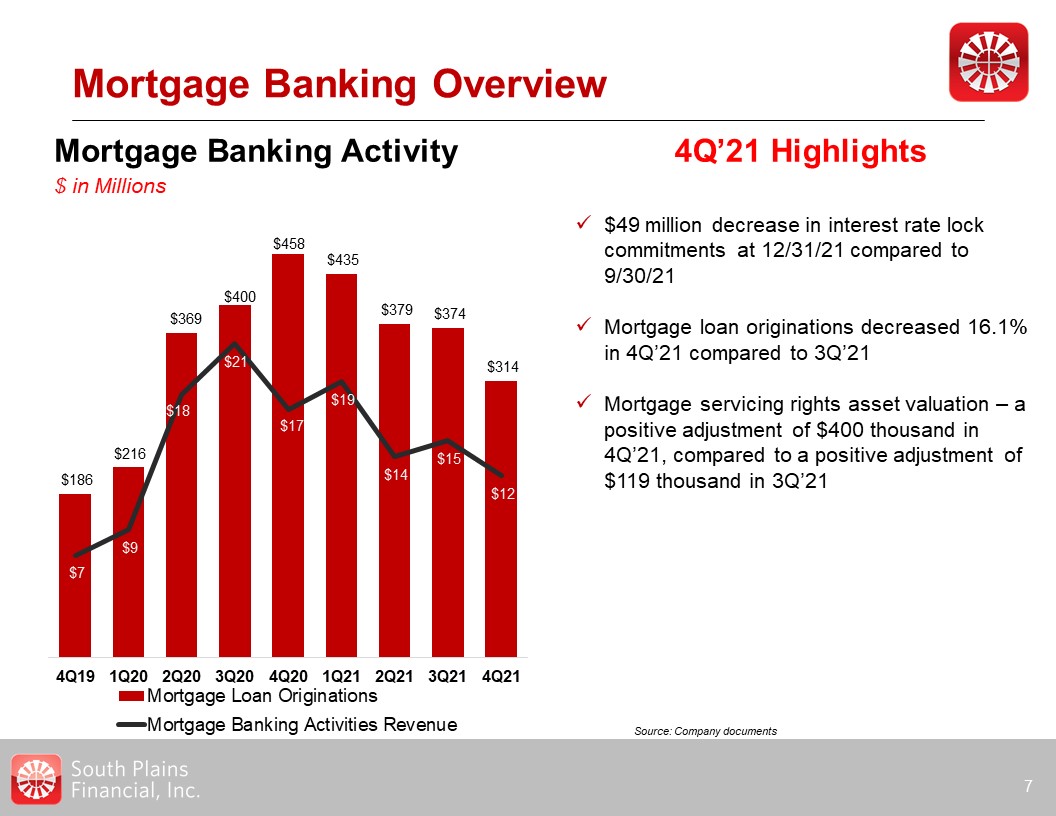
Mortgage Banking Overview 7 Mortgage Banking Activity$ in Millions 4Q’21 Highlights $49 million
decrease in interest rate lock commitments at 12/31/21 compared to 9/30/21Mortgage loan originations decreased 16.1% in 4Q’21 compared to 3Q’21Mortgage servicing rights asset valuation – a positive adjustment of $400 thousand in 4Q’21,
compared to a positive adjustment of $119 thousand in 3Q’21 Source: Company documents
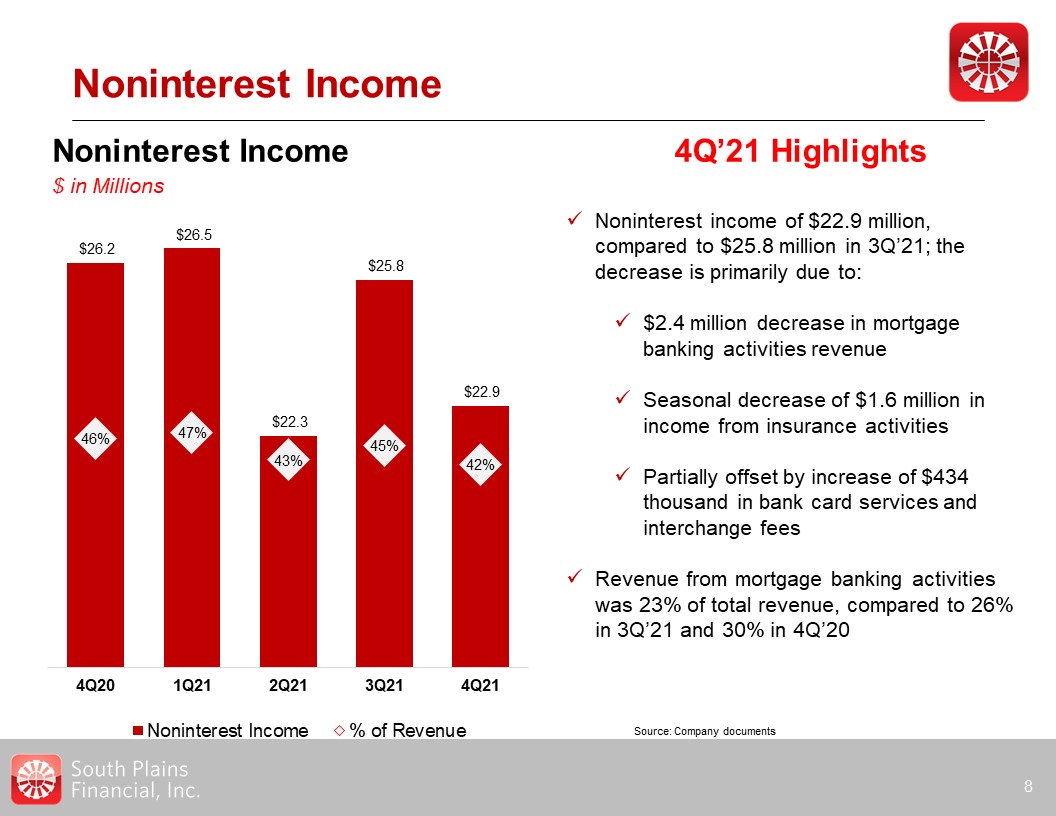
Noninterest Income 8 Noninterest Income$ in Millions 4Q’21 Highlights Noninterest income of $22.9
million, compared to $25.8 million in 3Q’21; the decrease is primarily due to:$2.4 million decrease in mortgage banking activities revenueSeasonal decrease of $1.6 million in income from insurance activitiesPartially offset by increase of
$434 thousand in bank card services and interchange feesRevenue from mortgage banking activities was 23% of total revenue, compared to 26% in 3Q’21 and 30% in 4Q’20 Source: Company documents

Diversified Revenue Stream Twelve Months Ended December 31, 2021 9 Total Revenues$219.2
million Noninterest Income$97.5 million Source: Company documents
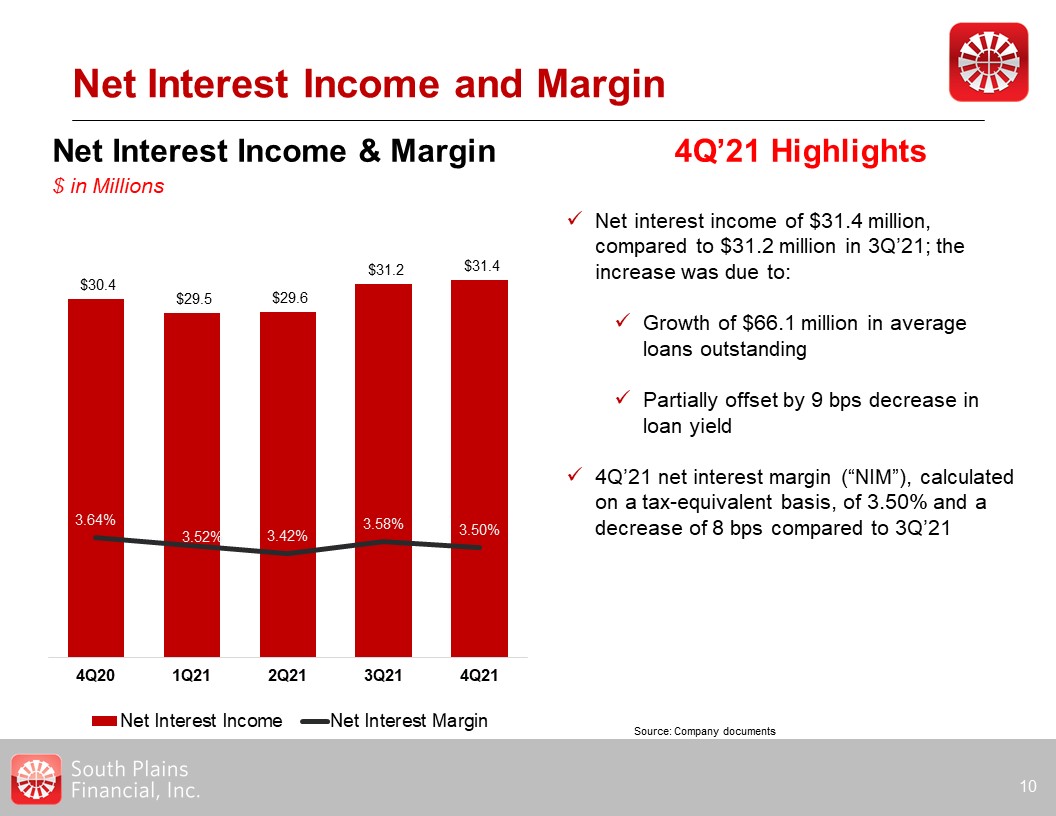
Net Interest Income and Margin 10 Net Interest Income & Margin$ in Millions 4Q’21
Highlights Net interest income of $31.4 million, compared to $31.2 million in 3Q’21; the increase was due to:Growth of $66.1 million in average loans outstandingPartially offset by 9 bps decrease in loan yield4Q’21 net interest margin
(“NIM”), calculated on a tax-equivalent basis, of 3.50% and a decrease of 8 bps compared to 3Q’21 Source: Company documents

Deposit Portfolio 11 Total Deposits$ in Millions 4Q’21 Highlights Total Deposits of $3.34 billion
at 4Q’21, an increase of $129 million from 3Q’21Largest increase was experienced in personal accounts Cost of interest-bearing deposits declined in 4Q’21 to 35 bps from 37 bps in 3Q’21Noninterest-bearing deposits represented 32.1% of deposits
in 4Q’21, compared to 32.8% in 3Q’21 Source: Company documents
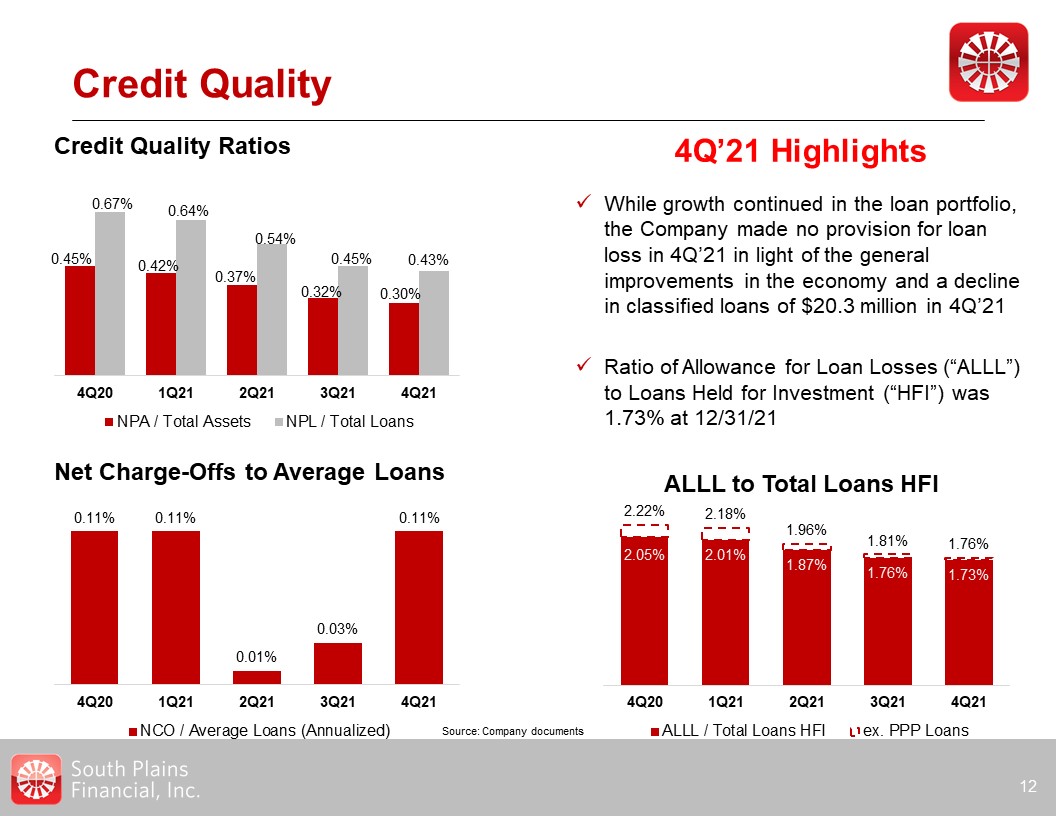
Credit Quality 12 4Q’21 Highlights Credit Quality Ratios While growth continued in the loan
portfolio, the Company made no provision for loan loss in 4Q’21 in light of the general improvements in the economy and a decline in classified loans of $20.3 million in 4Q’21Ratio of Allowance for Loan Losses (“ALLL”) to Loans Held for
Investment (“HFI”) was 1.73% at 12/31/21 Net Charge-Offs to Average Loans ALLL to Total Loans HFI Source: Company documents
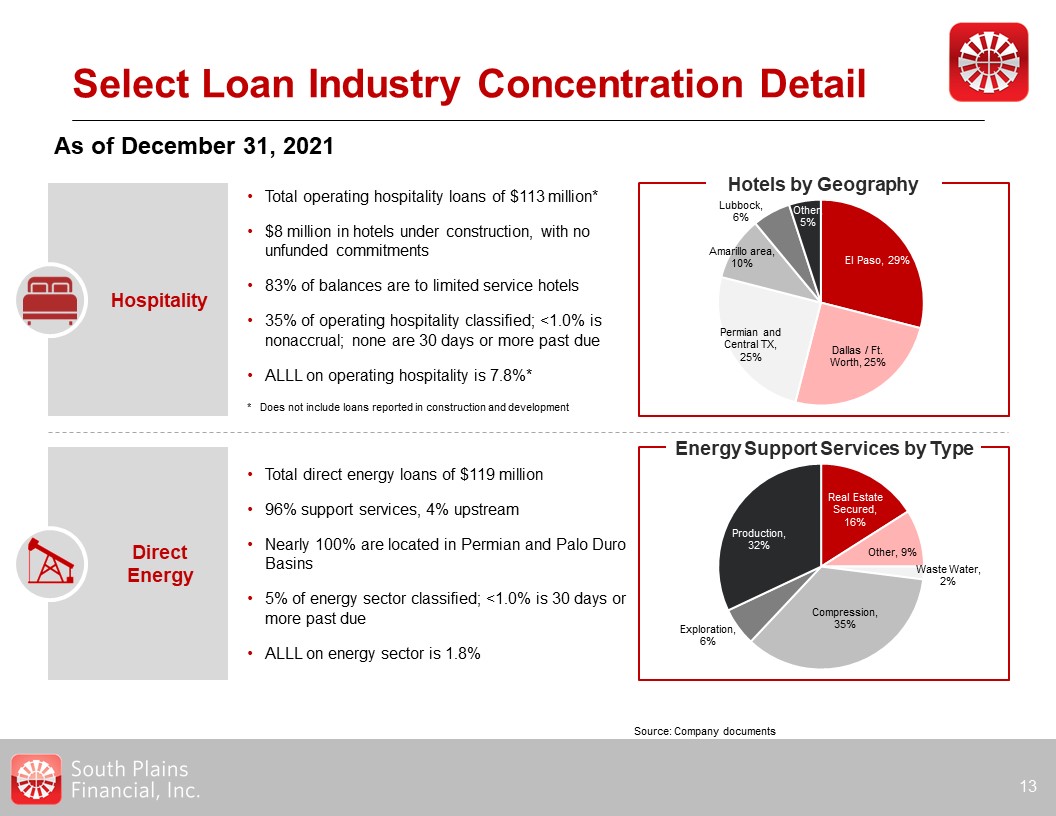
DirectEnergy Select Loan Industry Concentration Detail 13 As of December 31,
2021 Hospitality Total operating hospitality loans of $113 million*$8 million in hotels under construction, with no unfunded commitments83% of balances are to limited service hotels35% of operating hospitality classified; <1.0% is
nonaccrual; none are 30 days or more past dueALLL on operating hospitality is 7.8%** Does not include loans reported in construction and development Total direct energy loans of $119 million96% support services, 4% upstreamNearly 100% are
located in Permian and Palo Duro Basins5% of energy sector classified; <1.0% is 30 days or more past dueALLL on energy sector is 1.8% Hotels by Geography Source: Company documents Energy Support Services by Type
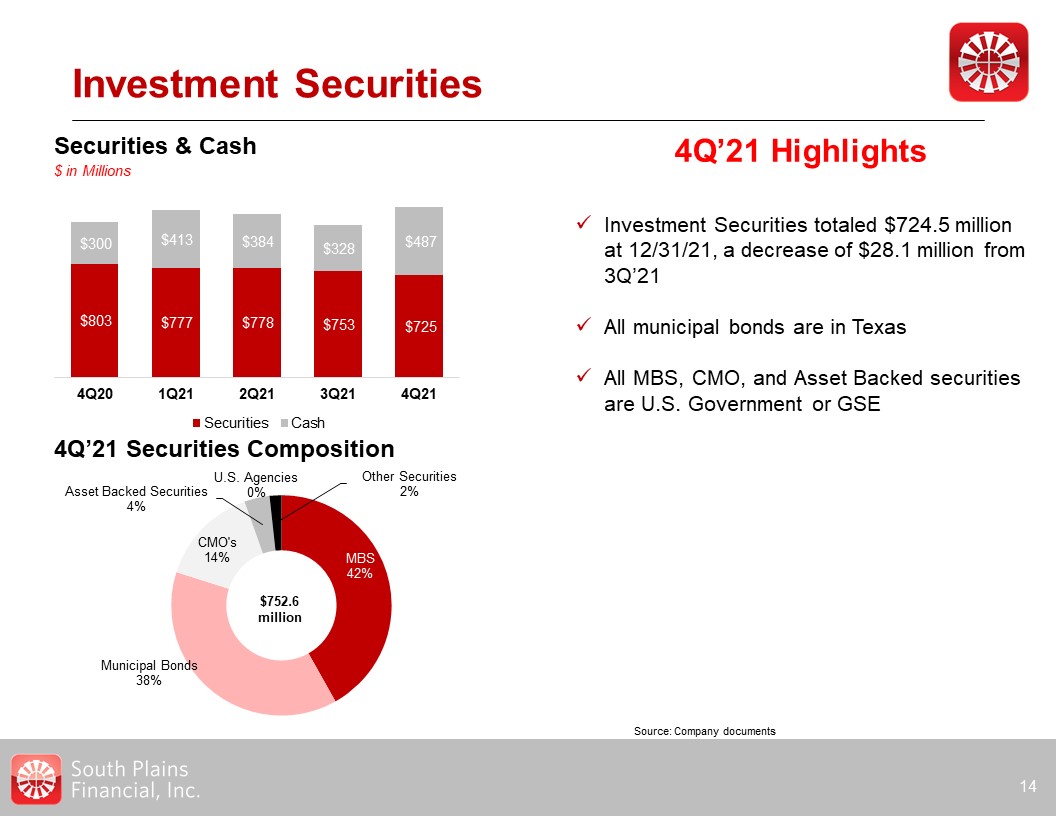
Investment Securities 14 4Q’21 Highlights Investment Securities totaled $724.5 million at
12/31/21, a decrease of $28.1 million from 3Q’21All municipal bonds are in TexasAll MBS, CMO, and Asset Backed securities are U.S. Government or GSE 4Q’21 Securities Composition $752.6million Securities & Cash$ in Millions Source:
Company documents

Noninterest Expense and Efficiency 15 Noninterest Expense$ in Millions 4Q’21 Highlights Noninterest
expense for 4Q’21 decreased $2.0 million from 3Q’21 primarily due to:$1.1 million decrease in personnel expense related to the seasonal decline in insurance activities$854 thousand decrease in mortgage commissions due to the decline in
mortgage loan originations during 4Q’21Partially offset by an $881 thousand increase in professional services expensesManagement continues to focus on reducing fixed expenses to drive improved profitability Source: Company documents
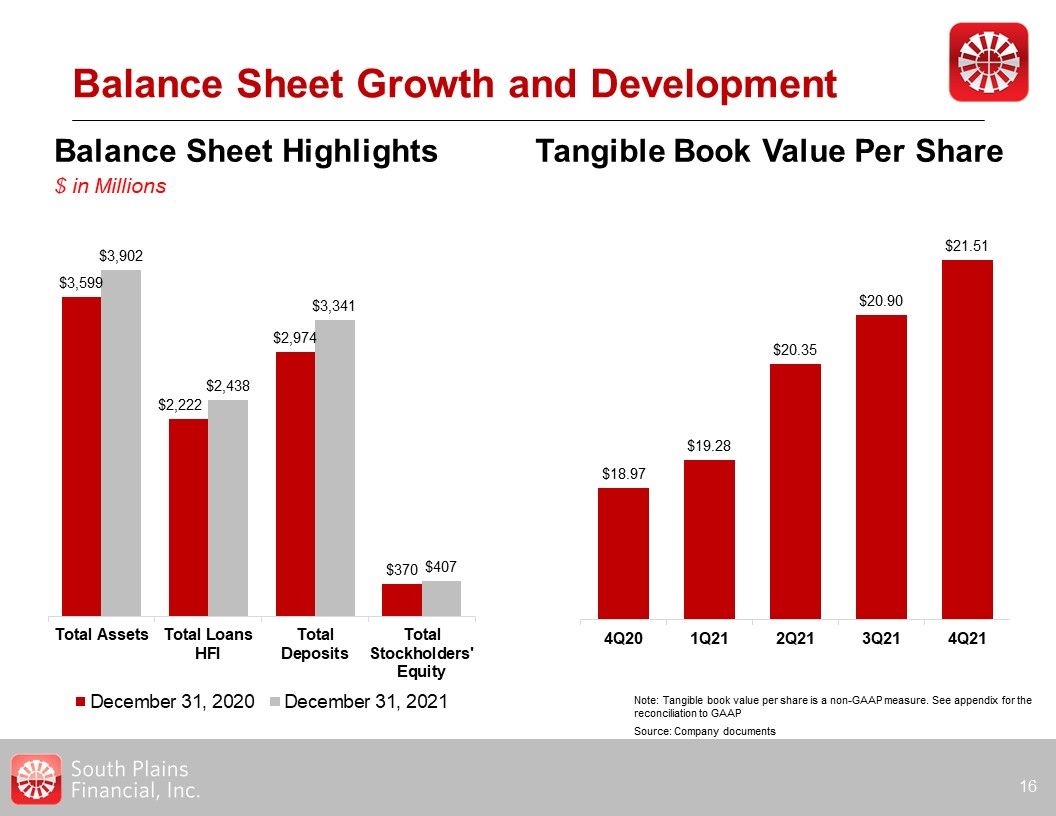
Balance Sheet Highlights$ in Millions Balance Sheet Growth and Development 16 Tangible Book Value
Per Share Note: Tangible book value per share is a non-GAAP measure. See appendix for the reconciliation to GAAP Source: Company documents
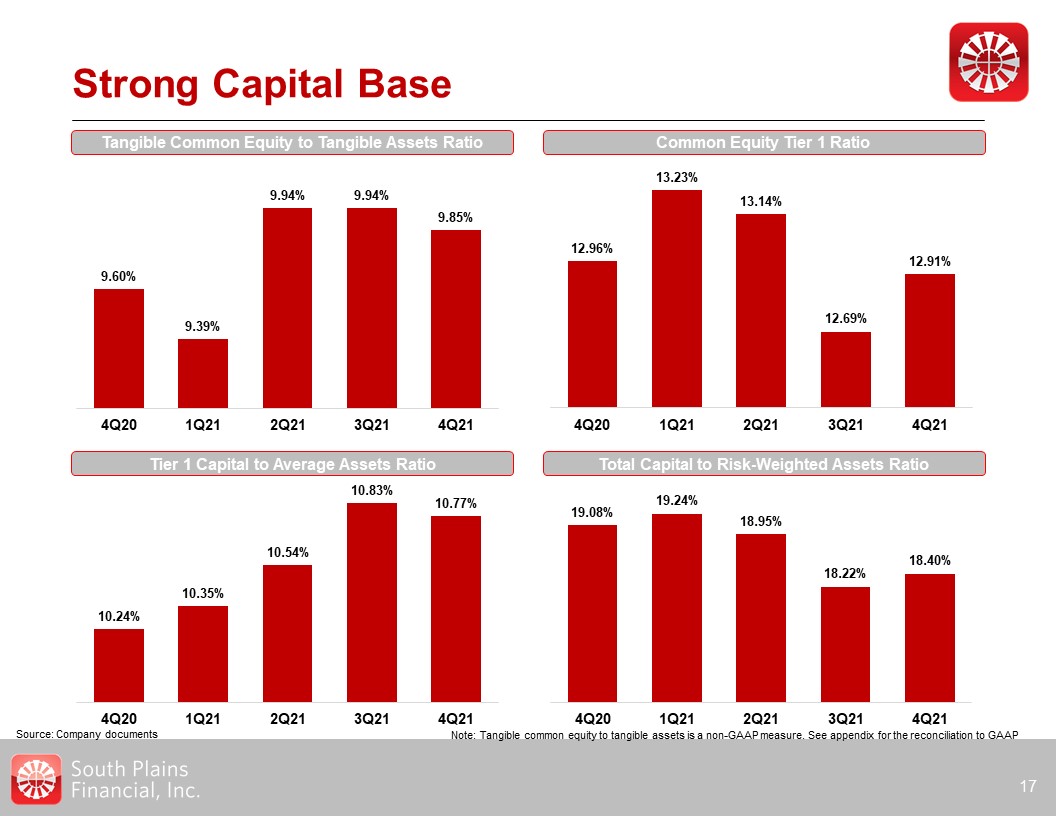
Strong Capital Base 17 Tangible Common Equity to Tangible Assets Ratio Common Equity Tier 1
Ratio Tier 1 Capital to Average Assets Ratio Total Capital to Risk-Weighted Assets Ratio Source: Company documents Note: Tangible common equity to tangible assets is a non-GAAP measure. See appendix for the reconciliation to GAAP

Appendix 18

Non-GAAP Financial Measures 19 As of and for the quarter ended
December 31,2021 September 30,2021 June 30,2021 March 31,2021 December 31,2020 Pre-Tax, Pre-Provision Income Net income $ 14,614 $ 15,190 $ 13,650
$ 15,160 $ 15,924 Income tax expense 3,631 3,716 3,422 3,738 3,968 Provision for loan losses - - (2,007 ) 89 141 Pre-tax,
pre-provision income $ 18,245 $ 18,906 $ 15,065 $ 18,987 $ 20,033 Unaudited$ in Thousands Source: Company documents As of the quarter ended December 31,2021 September 30,2021
June 30,2021 March 31,2021 December 31,2020 Tangible common equity Total common stockholders' equity $ 407,427 $ 398,276 $ 392,815 $ 374,671 $ 370,048 Less:
goodwill and other intangibles (25,403) (25,804) (26,226) (26,648) (27,070) Tangible common equity $ 382,024 $ 372,472 $ 366,589 $ 348,023
$ 342,978 Tangible assets Total assets $ 3,901,855 $ 3,774,175 $ 3,712,915 $ 3,732,894 $ 3,599,160 Less: goodwill and other
intangibles (25,403) (25,804) (26,226) (26,648) (27,070) Tangible assets $ 3,876,452 $ 3,748,371 $ 3,686,689 $ 3,706,246 $ 3,572,090
Shares outstanding 17,760,243 17,824,094 18,014,398 18,053,229 18,076,364 Total stockholders' equity to total assets 10.44%
10.55% 10.58% 10.04% 10.28% Tangible common equity to tangible assets 9.85% 9.94% 9.94% 9.39% 9.60% Book value per share $ 22.94 $ 22.34 $ 21.81 $ 20.75
$ 20.47 Tangible book value per share $ 21.51 $ 20.90 $ 20.35 $ 19.28 $ 18.97