UNITED STATES
SECURITIES AND EXCHANGE COMMISSION
Washington, D.C. 20549
FORM 8-K
CURRENT REPORT
Pursuant to Section 13 or 15(d) of
the Securities Exchange Act of 1934
Date of Report (Date of earliest event reported): October 23, 2025
(Exact name of registrant as specified in its charter)
|
|
|
|
|
(State or other jurisdiction of incorporation)
|
(Commission File Number)
|
(IRS Employer Identification No.)
|
|
|
|
|
|
(Address of principal executive offices)
|
(Zip Code)
|
(806 ) 792-7101
(Registrant’s telephone number, including area code)
Check the appropriate box below if the Form 8-K filing is intended to simultaneously satisfy the filing obligation of the registrant under any of the following
provisions:
|
Written communications pursuant to Rule 425 under the Securities Act (17 CFR 230.425)
|
|
Soliciting material pursuant to Rule 14a-12 under the Exchange Act (17 CFR 240.14a-12)
|
|
Pre-commencement communications pursuant to Rule 14d-2(b) under the Exchange Act (17 CFR 240.14d-2(b))
|
|
Pre-commencement communications pursuant to Rule 13e-4(c) under the Exchange Act (17 CFR 240.13e-4(c))
|
Securities registered pursuant to Section 12(b) of the Act:
|
Title of each class
|
Trading Symbol(s)
|
Name of each exchange on which registered
|
|
|
|
|
Indicate by check mark whether the registrant is an emerging growth company as defined in Rule 405 of the Securities Act of 1933 (§230.405 of this chapter) or Rule 12b-2
of the Securities Exchange Act of 1934 (§240.12b-2 of this chapter).
Emerging growth company ☐
If an emerging growth company, indicate by check mark if the registrant has elected not to use the extended transition period for complying with any new
or revised financial accounting standards provided pursuant to Section 13(a) of the Exchange Act. ☐
| Item 2.02 |
Results of Operations and Financial Condition.
|
On October 23, 2025, South Plains Financial, Inc. (the “Company”) issued a press release announcing its financial results for the third quarter ended September
30, 2025. A copy of the Company’s press release covering such announcement and certain other matters is furnished as Exhibit 99.1 to this Current Report on Form 8-K.
| Item 7.01 |
Regulation FD Disclosure.
|
On October 23, 2025, officers of the Company will conduct a conference call at 5:00 p.m., Eastern Time, with respect to the Company’s financial results for the third quarter ended September 30, 2025. An earnings release slide presentation highlighting the Company’s financial results for the third quarter ended September 30, 2025 is furnished as Exhibit 99.2 to this Current Report on Form 8-K. This earnings release slide presentation will also be
available on the Company’s website, www.spfi.bank, under the “News & Events” section.
In accordance with General Instruction B.2 of Form 8-K, the information in Items 2.02 and 7.01 of this Current Report on Form 8-K, including
Exhibit 99.1 and Exhibit 99.2 furnished herewith, shall not be deemed “filed” for the purposes of Section 18 of the Securities Exchange Act of 1934, as amended (the “Exchange Act”), or otherwise subject to the liabilities of that section. The
information in Items 2.02 and 7.01 of this Current Report on Form 8-K, including Exhibit 99.1 and Exhibit 99.2 furnished herewith, shall not be incorporated by reference into any filing or other document pursuant to the Exchange Act or the
Securities Act of 1933, as amended, except as shall be expressly set forth by specific reference in such filing or document.
| Item 9.01 |
Financial Statements and Exhibits.
|
|
(d)
|
Exhibits.
|
|
|
Press release, dated October 23, 2025, announcing third quarter 2025 financial results of South Plains Financial, Inc.
|
||
|
Earnings release slide presentation, dated October 23, 2025.
|
||
|
104
|
Cover Page Interactive Data File (formatted as Inline XBRL).
|
SIGNATURES
Pursuant to the requirements of the Securities Exchange Act of 1934, the registrant has duly caused this report to be signed on its behalf by the
undersigned hereunto duly authorized.
|
SOUTH PLAINS FINANCIAL, INC.
|
||
|
Date: October 23, 2025
|
By:
|
/s/ Steven B. Crockett
|
|
Steven B. Crockett
|
||
|
Chief Financial Officer and Treasurer
|
Exhibit 99.1
 |
South Plains Financial, Inc. Reports Third Quarter 2025 Financial Results
LUBBOCK, Texas, October 23, 2025 (GLOBE NEWSWIRE) – South Plains Financial, Inc. (NASDAQ:SPFI) (“South Plains” or the “Company”), the parent
company of City Bank (“City Bank” or the “Bank”), today reported its financial results for the quarter ended September 30, 2025.
Third Quarter 2025 Highlights
| ● |
Net income for the third quarter of 2025 was $16.3 million, compared to $14.6 million for the second quarter of 2025 and $11.2 million for the third quarter of
2024.
|
| ● |
Diluted earnings per share for the third quarter of 2025 was $0.96, compared to $0.86 for the second quarter of 2025 and $0.66 for the third quarter of 2024.
|
| ● |
Average cost of deposits for the third quarter of 2025 was 210 basis points, compared to 214 basis points for the second quarter of 2025 and 247 basis points
for the third quarter of 2024.
|
| ● |
Net interest margin, on a tax-equivalent basis, was 4.05% for the third quarter of 2025, compared to 4.07% for the second quarter of 2025 and 3.65% for the
third quarter of 2024.
|
| ● |
Return on average assets for the third quarter of 2025 was 1.47%, compared to 1.34% for the second quarter of 2025 and 1.05% for the third quarter of 2024.
|
| ● |
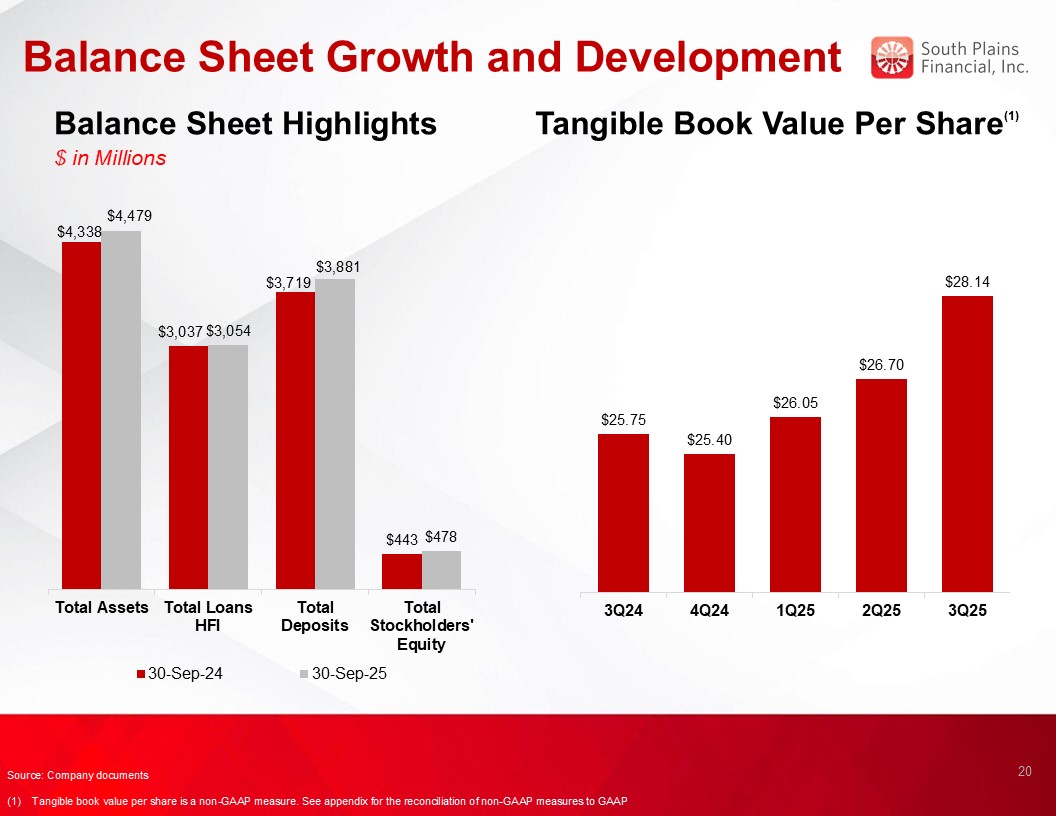
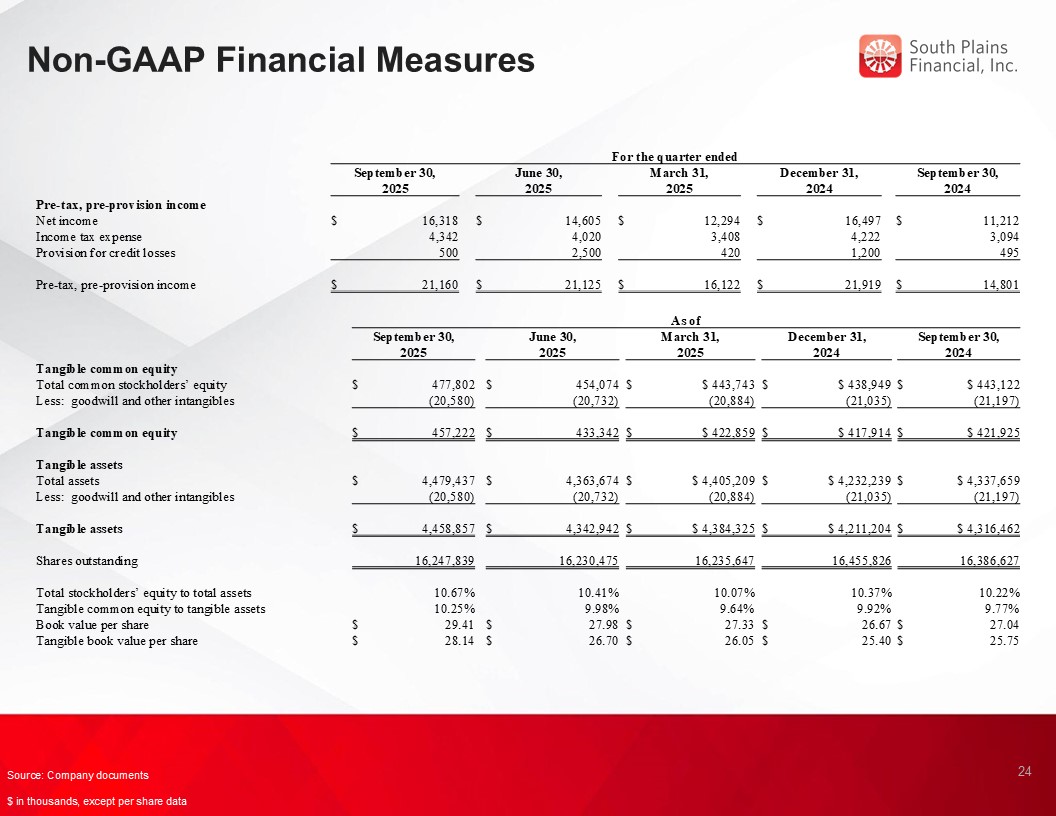
Tangible book value (non-GAAP) per share was $28.14 as of September 30, 2025, compared to $26.70 as of June 30, 2025 and $25.75 as of September 30, 2024.
|
| ● |
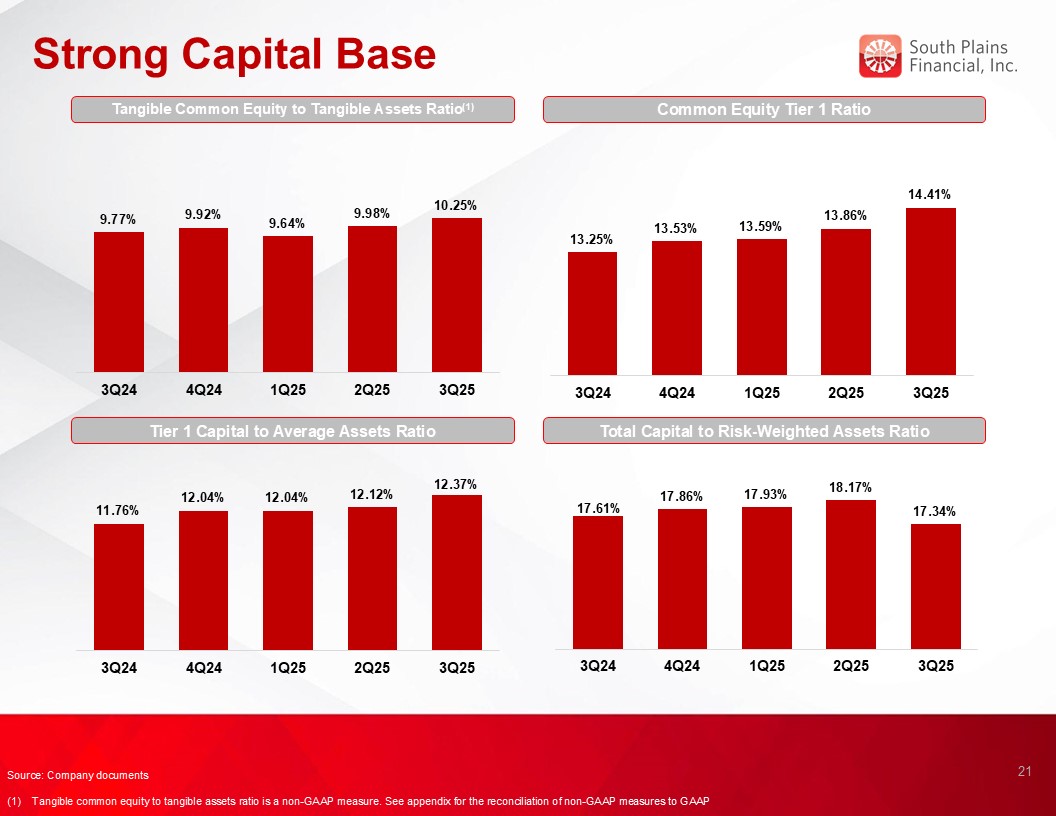
The consolidated total risk-based capital ratio, common equity tier 1 risk-based capital ratio, and tier 1 leverage ratio at September 30, 2025 were 17.34%,
14.41%, and 12.37%, respectively.
|
Curtis Griffith, South Plains’ Chairman and Chief Executive Officer, commented, “We delivered strong third quarter results highlighted by solid earnings growth as we
continued to experience net interest income expansion supported by our low cost, community-based deposit franchise. The credit quality of our loan portfolio also continued to improve as did our return on average assets. Our results demonstrate the
strong foundation that we have purposefully built. We have added exceptional talent across the Bank while also making the necessary investments in our technology platform that positions South Plains to efficiently scale our operations as we grow. I
believe the Bank is firmly positioned to accelerate our asset growth through both organic expansion and accretive M&A opportunities. While we have been experiencing higher than normal paydowns which has proved a headwind to loan growth, we
expect an acceleration in growth next year aided by the expansion of our lending platform where we expect to further increase our lending team by up to 20%. We continue to engage in discussions with potential target banks in our core markets
although we are only interested in acquiring a bank that fits our conservative nature and overall culture, and meets our strict criteria for a deal. As a result, we will only do a deal that makes sense for the Bank and our shareholders.”
Results of Operations, Quarter Ended September 30, 2025
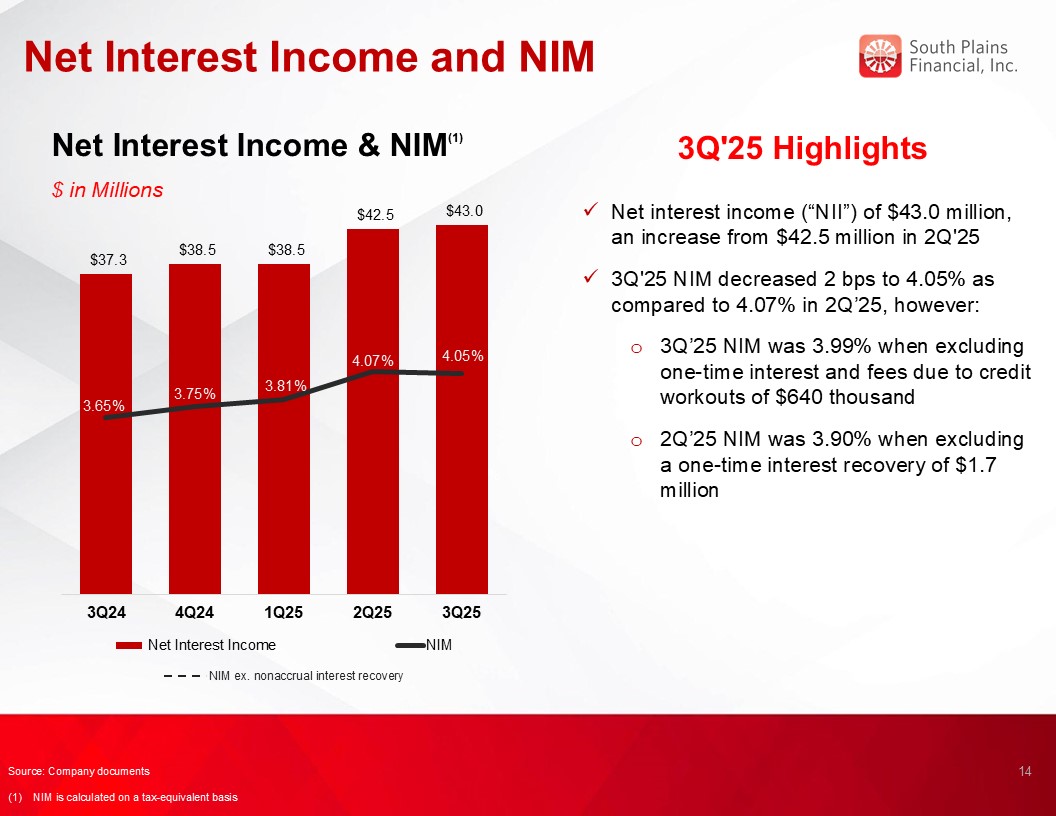
Net Interest Income
Net interest income was $43.0 million for the third quarter of 2025, compared to $42.5 million for the second quarter of 2025 and $37.3 million
for the third quarter of 2024. Net interest margin, calculated on a tax-equivalent basis, was 4.05% for the third quarter of 2025, compared to 4.07% for the second quarter of 2025 and 3.65% for the third quarter of 2024. The average yield on loans
was 6.92% for the third quarter of 2025, compared to 6.99% for the second quarter of 2025 and 6.68% for the third quarter of 2024. The average cost of deposits was 210 basis points for the third quarter of 2025, which is 4 basis points lower than
the second quarter of 2025 and 37 basis points lower than the third quarter of 2024. Loan interest income for the third quarter of 2025 included $640 thousand in interest and fees recognized related to the resolution of credit workouts. This amount
positively impacted the net interest margin by 6 basis points and the loan yield by 8 basis points during the third quarter of 2025. There was a recovery of $1.7 million in interest during the second quarter of 2025, related to the full repayment
of a loan that had previously been on nonaccrual. This recovery positively impacted the net interest margin by 17 basis points and the loan yield by 23 basis points during the second quarter of 2025.
Interest income was $64.5 million for the third quarter of 2025, compared to $64.1 million for the second quarter of 2025 and $61.6 million for
the third quarter of 2024. Interest income increased $385 thousand in the third quarter of 2025 from the second quarter of 2025, which was primarily comprised of an increase of $343 thousand in interest income on other earning assets. The increase
in interest income on other earning assets was mainly due to an increase of $32.8 million in average other interest-earning assets during the third quarter of 2025. Interest income increased $2.9 million in the third quarter of 2025 compared to the
third quarter of 2024. This increase was primarily due to the $640 thousand of loan interest and fees and an increase of average loans of $23.6 million and higher loan interest rates during the period, resulting in growth of $2.4 million in loan
interest income.
Interest expense was $21.5 million for the third quarter of 2025, compared to $21.6 million for the second quarter of 2025 and $24.3 million for
the third quarter of 2024. Interest expense decreased $131 thousand compared to the second quarter of 2025 and decreased $2.8 million compared to the third quarter of 2024. The $2.8 million decrease was primarily a result of a 49 basis point
decline in the cost of interest-bearing deposits, partially offset by an increase of $71.5 million in average interest-bearing deposits in the third quarter of 2025 as compared to the third quarter of 2024.
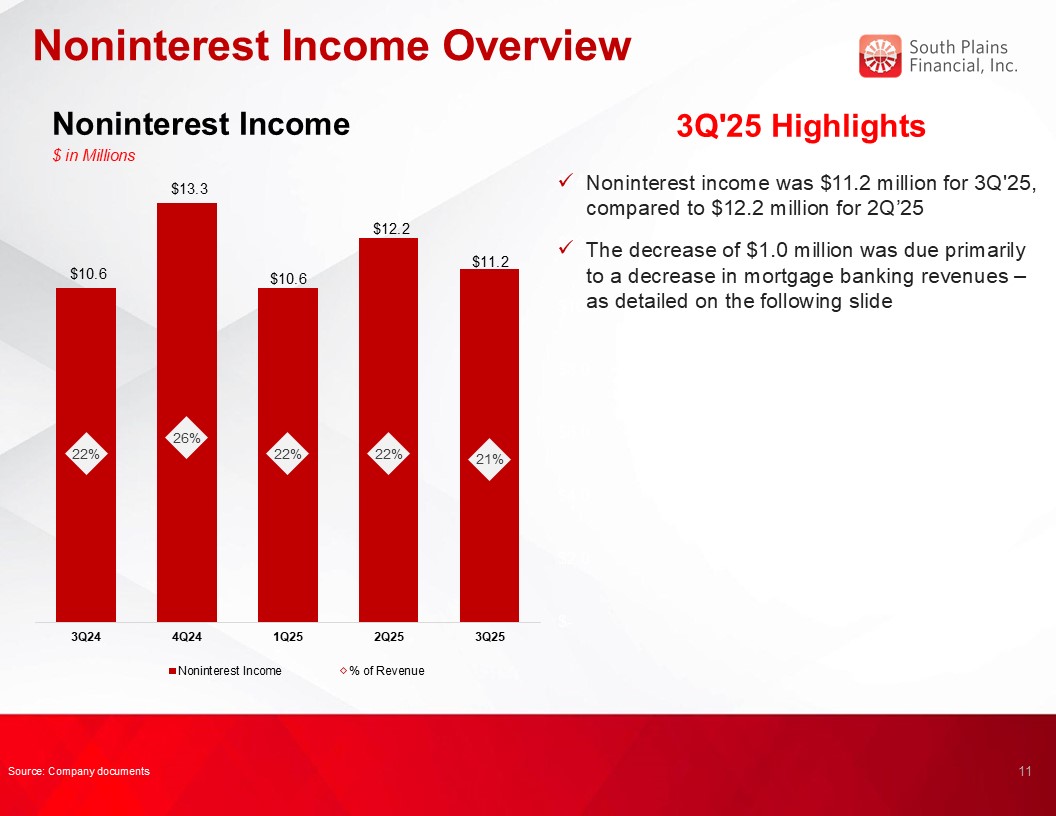
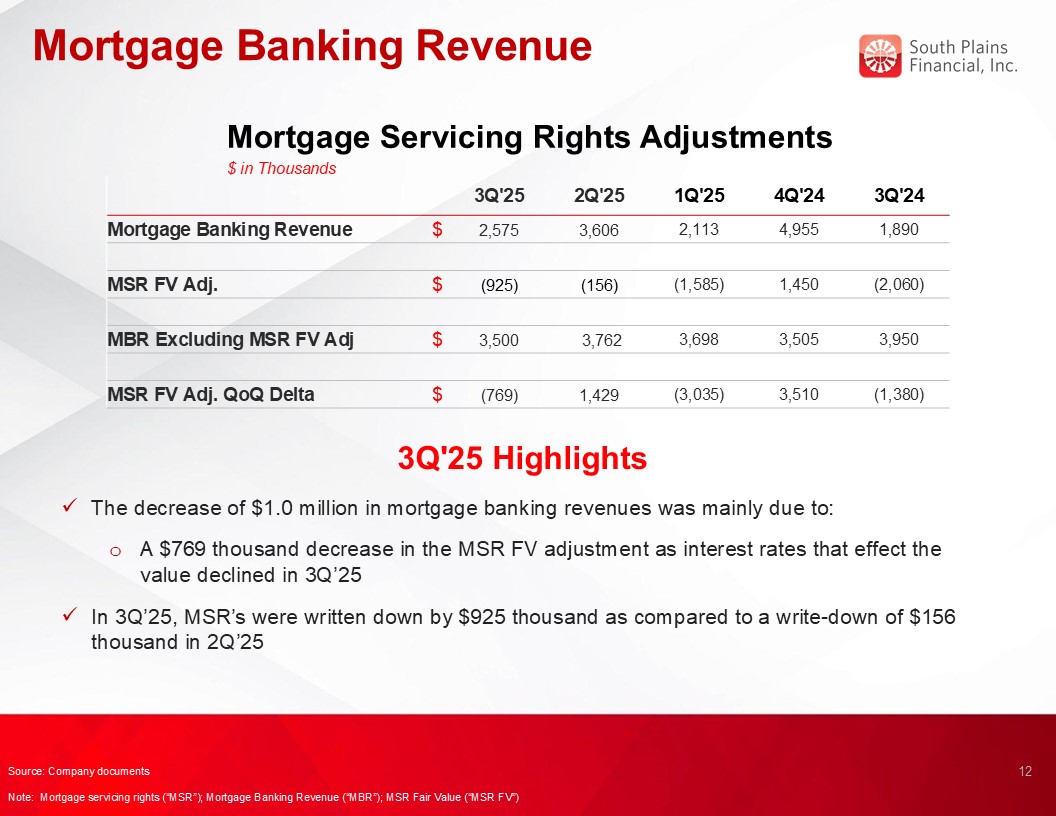
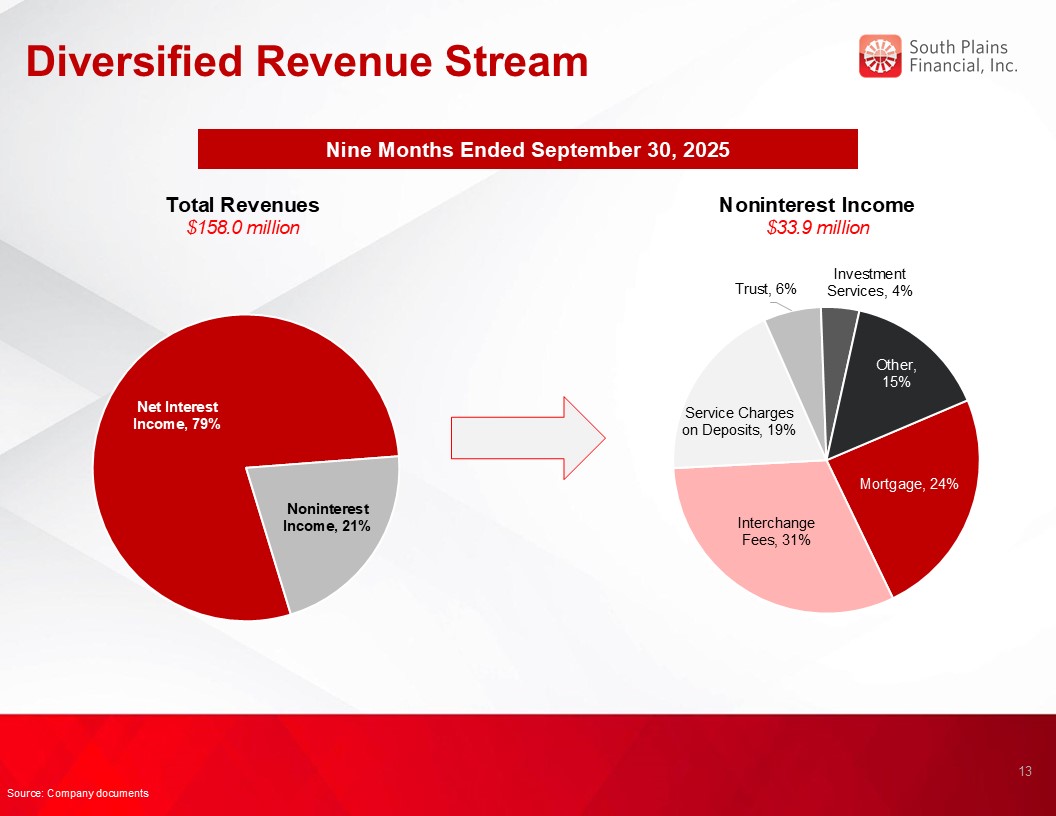
Noninterest Income and Noninterest Expense
Noninterest income was $11.2 million for the third quarter of 2025, compared to $12.2 million for the second quarter of 2025 and $10.6 million for
the third quarter of 2024. The decrease from the second quarter of 2025 was primarily due to a decrease of $1.0 million in mortgage banking revenues, mainly as a result of the change in the fair value adjustment of the mortgage servicing rights
assets – a write-down of $925 thousand in the third quarter of 2025 compared to a write-down of $156 thousand in the second quarter of 2025 – as interest rates that affect the value declined in the third quarter of 2025. The increase in noninterest
income for the third quarter of 2025 as compared to the third quarter of 2024 was primarily due to an increase of $685 thousand in mortgage banking revenues, mainly as a result of the change in the fair value adjustment of the mortgage servicing
rights assets – a write-down of $925 thousand in the third quarter of 2025 compared to a write-down of $2.1 million in the third quarter of 2024 – as interest rates that affect the value declined in the third quarter of 2025.
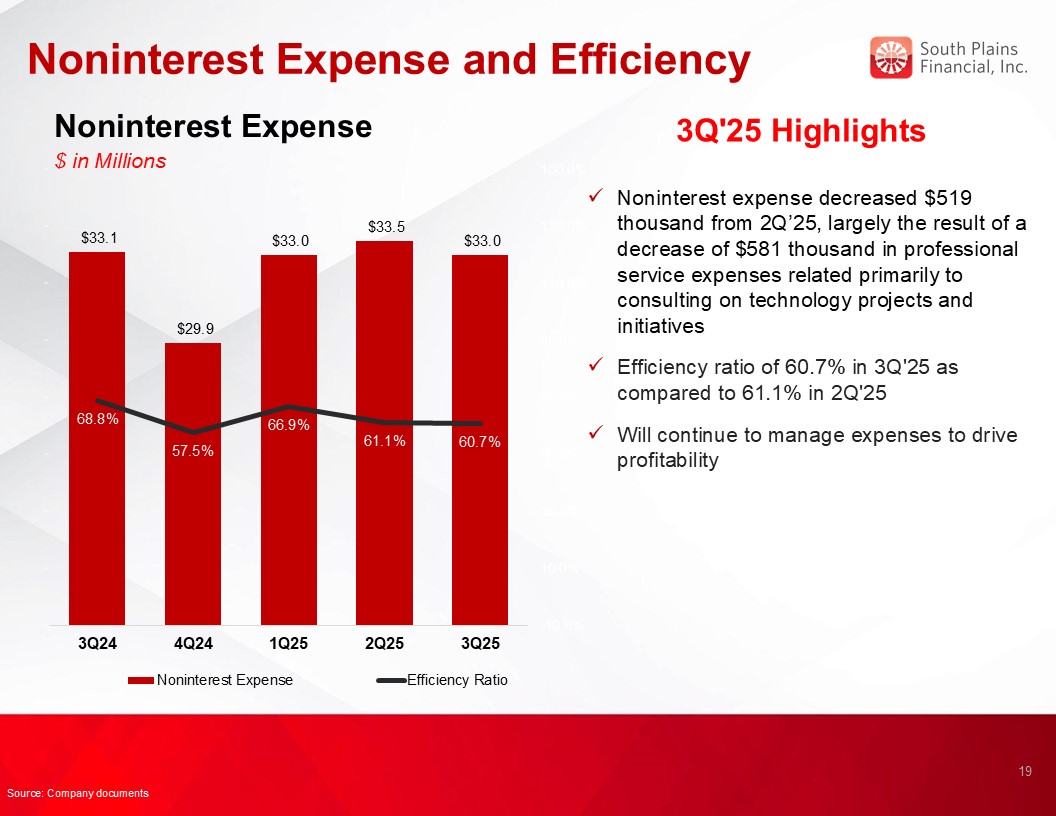
Noninterest expense was $33.0 million for the third quarter of 2025, compared to $33.5 million for the second quarter of 2025 and $33.1 million
for the third quarter of 2024. The $519 thousand decrease from the second quarter of 2025 was largely the result of a decrease of $581 thousand in professional service expenses related primarily to consulting on technology projects and initiatives.
The $104 thousand decrease in noninterest expense for the third quarter of 2025 as compared to the third quarter of 2024 was largely the result of a decrease in professional service expenses of $514 thousand and a decrease of $258 thousand in other
noninterest expenses, partially offset by an increase of $616 thousand in personnel expenses, mainly a result of annual salary adjustments. The $514 thousand decrease in professional service expense was mainly due to higher legal expense as well as
consulting related to technology projects in the third quarter of 2024.
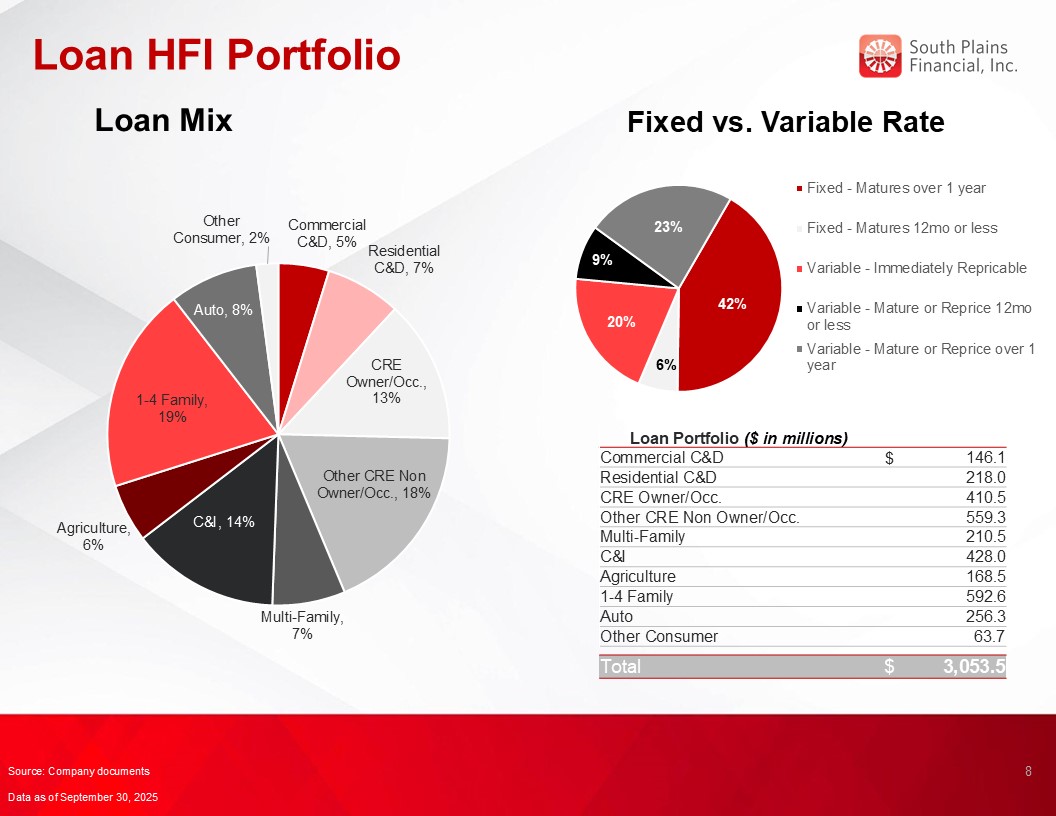
Loan Portfolio and Composition
Loans held for investment were $3.05 billion as of September 30, 2025, compared to $3.10 billion as of June 30, 2025 and $3.04 billion as of
September 30, 2024. The decrease of $45.5 million, or 1.5%, during the third quarter of 2025 as compared to the second quarter of 2025 occurred primarily as a result of a decrease of $46.5 million in multi-family property loans mainly due to the
payoff of two loans totaling $39.6 million, partially offset by organic loan growth. As of September 30, 2025, loans held for investment were essentially unchanged as compared to September 30, 2024.
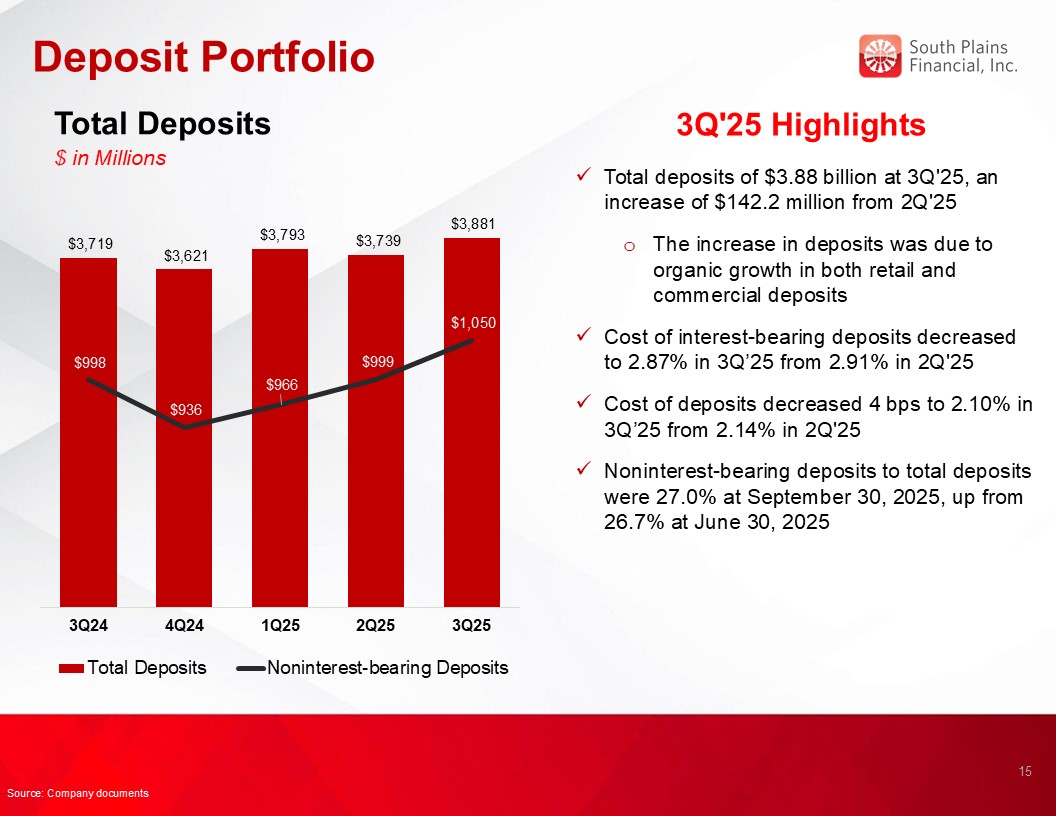
Deposits and Borrowings
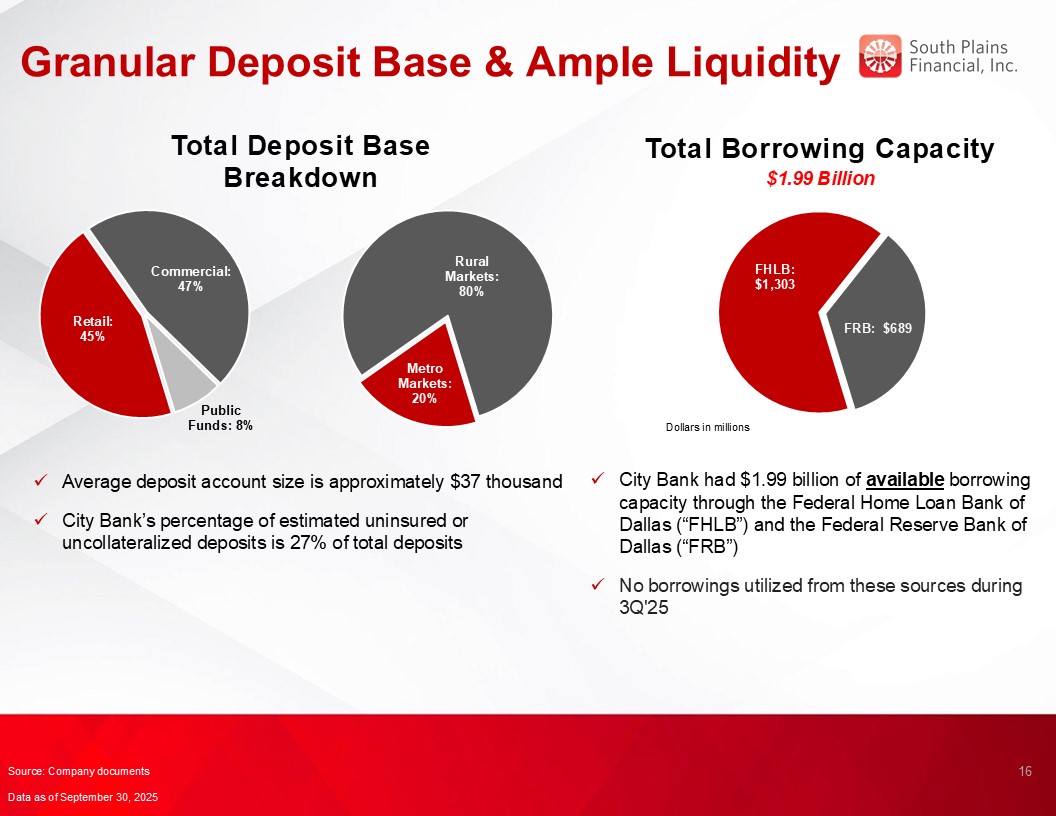
Deposits totaled $3.88 billion as of September 30, 2025, compared to $3.74 billion as of June 30, 2025 and $3.72 billion as of September 30, 2024.
Deposits increased by $142.2 million, or 3.8%, in the third quarter of 2025 from June 30, 2025. Deposits increased by $161.8 million, or 4.3%, at September 30, 2025 as compared to September 30, 2024. Noninterest-bearing deposits were $1.05 billion
as of September 30, 2025, compared to $998.8 million as of June 30, 2025 and $998.5 million as of September 30, 2024. Noninterest-bearing deposits represented 27.0% of total deposits as of September 30, 2025. The quarterly and year-over-year
changes in total deposits were due to organic growth in both retail and commercial deposits.
On September 30, 2025, the Company redeemed $50 million in subordinated debt. The subordinated debt was at the end of the initial five-year fixed
rate period. After the expiration of the fixed rate period, the subordinated debt would have reset quarterly at a higher variable interest rate as well as being subject to a reduction in regulatory capital treatment.
Asset Quality
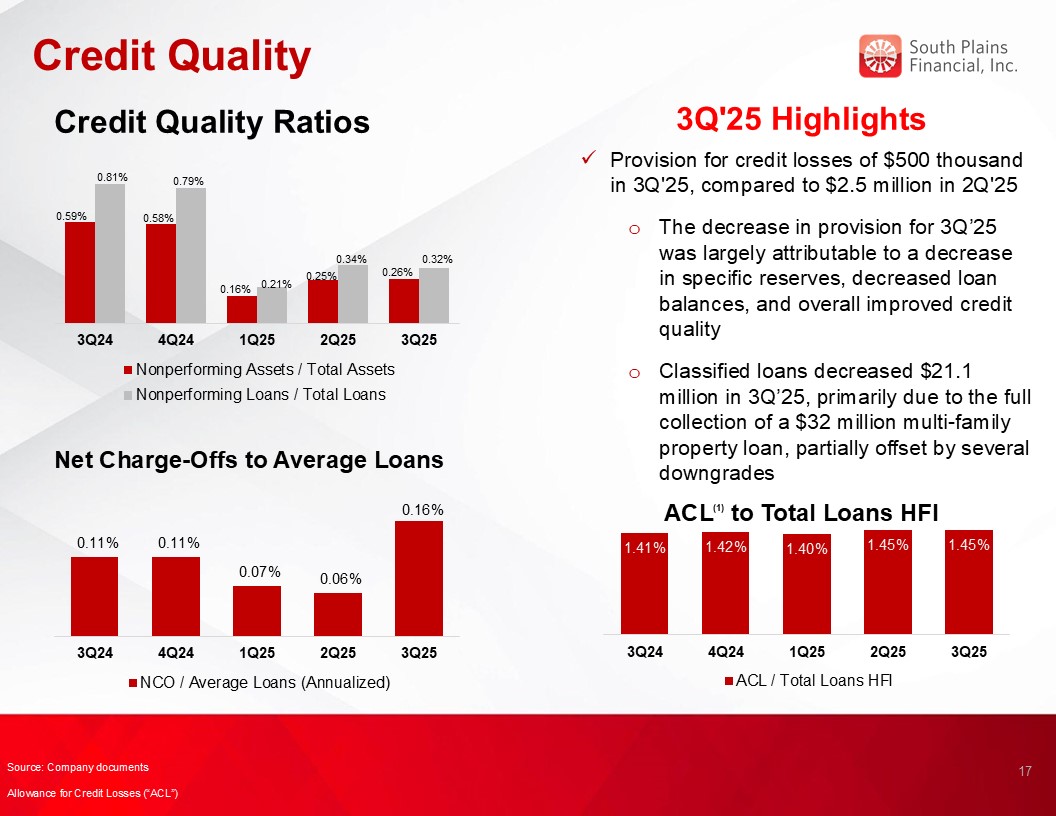
The Company recorded a provision for credit losses in the third quarter of 2025 of $500 thousand, compared to $2.5 million in the second quarter
of 2025 and $495 thousand in the third quarter of 2024. The decrease in provision for the third quarter of 2025 as compared to the second quarter of 2025 was largely attributable to a decrease in specific reserves, decreased loan balances, and
overall improved credit quality.
The ratio of allowance for credit losses to loans held for investment was 1.45% as of September 30, 2025, compared to 1.45% as of June 30, 2025
and 1.41% as of September 30, 2024.
The ratio of nonperforming assets to total assets was 0.26% as of September 30, 2025, compared to
0.25% as of June 30, 2025 and 0.59% as of September 30, 2024. Annualized net charge-offs were 0.16% for the third quarter of 2025, compared to 0.06% for the second quarter of 2025 and 0.11% for the third quarter of 2024.
Capital
Book value per share increased to $29.41 at September 30, 2025, compared to $27.98 at June 30, 2025. The change was primarily driven by $13.7
million of net income after dividends paid and by an increase in accumulated other comprehensive income of $9.1 million. The ratio of tangible common equity to tangible assets (non-GAAP) increased 27 basis points to 10.25% at September 30, 2025.
Conference Call
South Plains will host a conference call to discuss its third quarter 2025 financial results today, October 23, 2025, at 5:00 p.m., Eastern Time.
Investors and analysts interested in participating in the call are invited to dial 1-877-407-9716 (international callers please dial 1-201-493-6779) approximately 10 minutes prior to the start of the call. A live audio webcast of the conference
call and conference materials will be available on the Company’s website at https://www.spfi.bank/news-events/events.
A replay of the conference call will be available within two hours of the conclusion of the call and can be accessed on the investor section of
the Company’s website as well as by dialing 1-844-512-2921 (international callers please dial 1-412-317-6671). The pin to access the telephone replay is 13756126. The replay will be available until November 6, 2025.
About South Plains Financial, Inc.
South Plains is the bank holding company for City Bank, a Texas state-chartered bank headquartered in Lubbock, Texas. City Bank is one of the
largest independent banks in West Texas and has additional banking operations in the Dallas, El Paso, Greater Houston, the Permian Basin, and College Station, Texas markets, and the Ruidoso, New Mexico market. South Plains provides a wide range of
commercial and consumer financial services to small and medium-sized businesses and individuals in its market areas. Its principal business activities include commercial and retail banking, along with investment, trust and mortgage services. Please
visit https://www.spfi.bank for more information.
Non-GAAP Financial Measures
Some of the financial measures included in this press release are not measures of financial performance recognized in accordance with generally
accepted accounting principles in the United States (“GAAP”). These non-GAAP financial measures include Tangible Book Value Per Share, Tangible Common Equity to Tangible Assets, and Pre-Tax, Pre-Provision Income. The Company believes these non-GAAP
financial measures provide both management and investors a more complete understanding of the Company’s financial position and performance. These non-GAAP financial measures are supplemental and are not a substitute for any analysis based on GAAP
financial measures.
We classify a financial measure as being a non-GAAP financial measure if that financial measure excludes or includes amounts, or is subject to
adjustments that have the effect of excluding or including amounts, that are included or excluded, as the case may be, in the most directly comparable measure calculated and presented in accordance with GAAP as in effect from time to time in the
United States in our statements of income, balance sheets or statements of cash flows. Not all companies use the same calculation of these measures; therefore, this presentation may not be comparable to other similarly titled measures as presented
by other companies.
A reconciliation of non-GAAP financial measures to GAAP financial measures is provided at the end of this press release.
Available Information
The Company routinely posts important information for investors on its web site (under www.spfi.bank and, more specifically, under the News & Events tab at www.spfi.bank/news-events/press-releases). The Company
intends to use its web site as a means of disclosing material non-public information and for complying with its disclosure obligations under Regulation FD (Fair Disclosure) promulgated by the U.S. Securities and Exchange Commission (the “SEC”).
Accordingly, investors should monitor the Company’s web site, in addition to following the Company’s press releases, SEC filings, public conference calls, presentations and webcasts.
The information contained on, or that may be accessed through, the Company’s web site is not incorporated by reference into, and is not a part of,
this document.
Forward Looking Statements
This press release contains forward-looking statements within the meaning of the Private Securities Litigation Reform Act of 1995. These
forward-looking statements reflect South Plains’ current views with respect to future events and South Plains’ financial performance. Any statements about South Plains’ expectations, beliefs, plans, predictions, forecasts, objectives, assumptions
or future events or performance are not historical facts and may be forward-looking. These statements are often, but not always, made through the use of words or phrases such as “anticipate,” “believes,” “can,” “could,” “may,” “predicts,”
“potential,” “should,” “will,” “estimate,” “plans,” “projects,” “continuing,” “ongoing,” “expects,” “intends” and similar words or phrases. South Plains cautions that the forward-looking statements in this press release are based largely on South
Plains’ expectations and are subject to a number of known and unknown risks and uncertainties that are subject to change based on factors which are, in many instances, beyond South Plains’ control. Factors that could cause such changes include, but
are not limited to, the impact on us and our customers of a decline in general economic conditions and any regulatory responses thereto; slower economic growth rates or potential recession in the United States and our market areas; the impacts
related to or resulting from uncertainty in the banking industry as a whole; increased competition for deposits in our market areas among traditional and nontraditional financial services companies, and related changes in deposit customer behavior;
the impact of changes in market interest rates, whether due to a continuation of the elevated interest rate environment or further reductions in interest rates and a resulting decline in net interest income; the lingering inflationary pressures,
and the risk of the resurgence of elevated levels of inflation, in the United States and our market areas; the uncertain impacts of ongoing quantitative tightening and current and future monetary policies of the Board of Governors of the Federal
Reserve System; changes in unemployment rates in the United States and our market areas; adverse changes in customer spending, borrowing and savings habits; declines in commercial real estate values and prices; a deterioration of the credit rating
for U.S. long-term sovereign debt or the impact of uncertain or changing political conditions, including federal government shutdowns and uncertainty regarding United States fiscal debt, deficit and budget matters; cyber incidents or other
failures, disruptions or breaches of our operational or security systems or infrastructure, or those of our third-party vendors or other service providers, including as a result of cyber-attacks; severe weather, natural disasters, acts of war or
terrorism, geopolitical instability or other external events, including as a result of the policies of the current U.S. presidential administration or Congress; the impacts of tariffs, sanctions and other trade policies of the United States and its
global trading counterparts and the resulting impact on the Company and its customers; competition and market expansion opportunities; changes in non-interest expenditures or in the anticipated benefits of such expenditures; the risks related to
the development, implementation, use and management of emerging technologies, including artificial intelligence and machine learnings; potential costs related to the impacts of climate change; current or future litigation, regulatory examinations
or other legal and/or regulatory actions; and changes in applicable laws and regulations. Additional information regarding these risks and uncertainties to which South Plains’ business and future financial performance are subject is contained in
South Plains’ most recent Annual Report on Form 10-K and Quarterly Reports on Form 10-Q on file with the SEC, including the sections entitled “Risk Factors” and “Management’s Discussion and Analysis of Financial Condition and Results of Operations”
of such documents, and other documents South Plains files or furnishes with the SEC from time to time, which are available on the SEC’s website, www.sec.gov. Actual results, performance or achievements could differ materially from those
contemplated, expressed, or implied by the forward-looking statements due to additional risks and uncertainties of which South Plains is not currently aware or which it does not currently view as, but in the future may become, material to its
business or operating results. Due to these and other possible uncertainties and risks, the Company can give no assurance that the results contemplated in the forward-looking statements will be realized and readers are cautioned not to place undue
reliance on the forward-looking statements contained in this press release. Any forward-looking statements presented herein are made only as of the date of this press release, and South Plains does not undertake any obligation to update or revise
any forward-looking statements to reflect changes in assumptions, new information, the occurrence of unanticipated events, or otherwise, except as required by applicable law. All forward-looking statements, express or implied, included in the press
release are qualified in their entirety by this cautionary statement.
|
Contact:
|
Mikella Newsom, Chief Risk Officer and Secretary
|
|
(866) 771-3347
|
|
Source: South Plains Financial, Inc.
South Plains Financial, Inc.
Consolidated Financial Highlights - (Unaudited)
(Dollars in thousands, except share data)
|
As of and for the quarter ended
|
||||||||||||||||||||
|
September 30,
2025
|
June 30,
2025
|
March 31,
2025
|
December 31,
2024
|
September 30,
2024
|
||||||||||||||||
|
Selected Income Statement Data:
|
||||||||||||||||||||
|
Interest income
|
$
|
64,520
|
$
|
64,135
|
$
|
59,922
|
$
|
61,324
|
$
|
61,640
|
||||||||||
|
Interest expense
|
21,501
|
21,632
|
21,395
|
22,776
|
24,346
|
|||||||||||||||
|
Net interest income
|
43,019
|
42,503
|
38,527
|
38,548
|
37,294
|
|||||||||||||||
|
Provision for credit losses
|
500
|
2,500
|
420
|
1,200
|
495
|
|||||||||||||||
|
Noninterest income
|
11,165
|
12,165
|
10,625
|
13,319
|
10,635
|
|||||||||||||||
|
Noninterest expense
|
33,024
|
33,543
|
33,030
|
29,948
|
33,128
|
|||||||||||||||
|
Income tax expense
|
4,342
|
4,020
|
3,408
|
4,222
|
3,094
|
|||||||||||||||
|
Net income
|
16,318
|
14,605
|
12,294
|
16,497
|
11,212
|
|||||||||||||||
|
Per Share Data (Common Stock):
|
||||||||||||||||||||
|
Net earnings, basic
|
$
|
1.00
|
$
|
0.90
|
$
|
0.75
|
$
|
1.01
|
$
|
0.68
|
||||||||||
|
Net earnings, diluted
|
0.96
|
0.86
|
0.72
|
0.96
|
0.66
|
|||||||||||||||
|
Cash dividends declared and paid
|
0.16
|
0.15
|
0.15
|
0.15
|
0.14
|
|||||||||||||||
|
Book value
|
29.41
|
27.98
|
27.33
|
26.67
|
27.04
|
|||||||||||||||
|
Tangible book value (non-GAAP)
|
28.14
|
26.70
|
26.05
|
25.40
|
25.75
|
|||||||||||||||
|
Weighted average shares outstanding, basic
|
16,241,695
|
16,231,627
|
16,415,862
|
16,400,361
|
16,386,079
|
|||||||||||||||
|
Weighted average shares outstanding, dilutive
|
16,990,546
|
16,886,993
|
17,065,599
|
17,161,646
|
17,056,959
|
|||||||||||||||
|
Shares outstanding at end of period
|
16,247,839
|
16,230,475
|
16,235,647
|
16,455,826
|
16,386,627
|
|||||||||||||||
|
Selected Period End Balance Sheet Data:
|
||||||||||||||||||||
|
Cash and cash equivalents
|
$
|
635,046
|
$
|
470,496
|
$
|
536,300
|
$
|
359,082
|
$
|
471,167
|
||||||||||
|
Investment securities
|
571,138
|
570,000
|
571,527
|
577,240
|
606,889
|
|||||||||||||||
|
Total loans held for investment
|
3,053,503
|
3,098,978
|
3,075,860
|
3,055,054
|
3,037,375
|
|||||||||||||||
|
Allowance for credit losses
|
44,125
|
45,010
|
42,968
|
43,237
|
42,886
|
|||||||||||||||
|
Total assets
|
4,479,437
|
4,363,674
|
4,405,209
|
4,232,239
|
4,337,659
|
|||||||||||||||
|
Interest-bearing deposits
|
2,831,642
|
2,740,179
|
2,826,055
|
2,685,366
|
2,720,880
|
|||||||||||||||
|
Noninterest-bearing deposits
|
1,049,501
|
998,759
|
966,464
|
935,510
|
998,480
|
|||||||||||||||
|
Total deposits
|
3,881,143
|
3,738,938
|
3,792,519
|
3,620,876
|
3,719,360
|
|||||||||||||||
|
Borrowings
|
60,493
|
111,799
|
110,400
|
110,354
|
110,307
|
|||||||||||||||
|
Total stockholders’ equity
|
477,802
|
454,074
|
443,743
|
438,949
|
443,122
|
|||||||||||||||
|
Summary Performance Ratios:
|
||||||||||||||||||||
|
Return on average assets (annualized)
|
1.47%
|
|
1.34%
|
|
1.16%
|
|
1.53%
|
|
1.05%
|
|
||||||||||
|
Return on average equity (annualized)
|
13.89%
|
|
13.05%
|
|
11.30%
|
|
14.88%
|
|
10.36%
|
|
||||||||||
|
Net interest margin (1)
|
4.05%
|
|
4.07%
|
|
3.81%
|
|
3.75%
|
|
3.65%
|
|
||||||||||
|
Yield on loans
|
6.92%
|
|
6.99%
|
|
6.67%
|
|
6.69%
|
|
6.68%
|
|
||||||||||
|
Cost of interest-bearing deposits
|
2.87%
|
|
2.91%
|
|
2.93%
|
|
3.12%
|
|
3.36%
|
|
||||||||||
|
Efficiency ratio
|
60.69%
|
|
61.11%
|
|
66.90%
|
|
57.50%
|
|
68.80%
|
|
||||||||||
|
Summary Credit Quality Data:
|
|
|||||||||||||||||||
|
Nonperforming loans
|
$
|
9,709
|
$
|
10,463
|
$
|
6,467
|
$
|
24,023
|
$
|
24,693
|
||||||||||
|
Nonperforming loans to total loans held for investment
|
0.32%
|
|
0.34%
|
|
0.21%
|
|
0.79%
|
|
0.81%
|
|
||||||||||
|
Other real estate owned
|
$
|
1,827
|
$
|
535
|
$
|
600
|
$
|
530
|
$
|
973
|
||||||||||
|
Nonperforming assets to total assets
|
0.26%
|
|
0.25%
|
|
0.16%
|
|
0.58%
|
|
0.59%
|
|
||||||||||
|
Allowance for credit losses to total loans held for investment
|
1.45%
|
|
1.45%
|
|
1.40%
|
|
1.42%
|
|
1.41%
|
|
||||||||||
|
Net charge-offs to average loans outstanding (annualized)
|
0.16%
|
|
0.06%
|
|
0.07%
|
|
0.11%
|
|
0.11%
|
|
||||||||||
|
As of and for the quarter ended
|
||||||||||||||||||||
|
September 30
2025
|
June 30,
2025
|
March 31,
2025
|
December 31,
2024
|
September 30,
2024
|
||||||||||||||||
|
Capital Ratios:
|
||||||||||||||||||||
|
Total stockholders’ equity to total assets
|
10.67
|
%
|
10.41
|
%
|
10.07
|
%
|
10.37
|
%
|
10.22
|
%
|
||||||||||
|
Tangible common equity to tangible assets (non-GAAP)
|
10.25
|
%
|
9.98
|
%
|
9.64
|
%
|
9.92
|
%
|
9.77
|
%
|
||||||||||
|
Common equity tier 1 to risk-weighted assets
|
14.41
|
%
|
13.86
|
%
|
13.59
|
%
|
13.53
|
%
|
13.25
|
%
|
||||||||||
|
Tier 1 capital to average assets
|
12.37
|
%
|
12.12
|
%
|
12.04
|
%
|
12.04
|
%
|
11.76
|
%
|
||||||||||
|
Total capital to risk-weighted assets
|
17.34
|
%
|
18.17
|
%
|
17.93
|
%
|
17.86
|
%
|
17.61
|
%
|
||||||||||
| (1) |
Net interest margin is calculated as the annual net interest income, on a fully tax-equivalent basis, divided by average interest-earning assets.
|
South Plains Financial, Inc.
Average Balances and Yields - (Unaudited)
(Dollars in thousands)
|
For the Three Months Ended
|
||||||||||||||||||||||||
|
September 30, 2025
|
September 30, 2024
|
|||||||||||||||||||||||
|
Average
Balance
|
Interest
|
Yield/Rate
|
Average
Balance
|
Interest
|
Yield/Rate
|
|||||||||||||||||||
|
Assets
|
||||||||||||||||||||||||
|
Loans (1)
|
$
|
3,093,465
|
$
|
53,935
|
6.92
|
%
|
$
|
3,069,900
|
$
|
51,513
|
6.68
|
%
|
||||||||||||
|
Debt securities - taxable
|
498,302
|
4,638
|
3.69
|
%
|
524,641
|
5,300
|
4.02
|
%
|
||||||||||||||||
|
Debt securities - nontaxable
|
155,028
|
1,080
|
2.76
|
%
|
154,806
|
1,016
|
2.61
|
%
|
||||||||||||||||
|
Other interest-bearing assets
|
489,621
|
5,101
|
4.13
|
%
|
336,887
|
4,032
|
4.76
|
%
|
||||||||||||||||
|
Total interest-earning assets
|
4,236,416
|
64,754
|
6.06
|
%
|
4,086,234
|
61,861
|
6.02
|
%
|
||||||||||||||||
|
Noninterest-earning assets
|
167,437
|
172,922
|
||||||||||||||||||||||
|
Total assets
|
$
|
4,403,853
|
$
|
4,259,156
|
||||||||||||||||||||
|
Liabilities & stockholders’ equity
|
||||||||||||||||||||||||
|
NOW, Savings, MMDA’s
|
$
|
2,325,281
|
16,007
|
2.73
|
%
|
$
|
2,247,299
|
18,143
|
3.21
|
%
|
||||||||||||||
|
Time deposits
|
424,788
|
3,918
|
3.66
|
%
|
431,307
|
4,510
|
4.16
|
%
|
||||||||||||||||
|
Short-term borrowings
|
7
|
-
|
0.00
|
%
|
3
|
-
|
0.00
|
%
|
||||||||||||||||
|
Notes payable & other long-term borrowings
|
-
|
-
|
0.00
|
%
|
-
|
-
|
0.00
|
%
|
||||||||||||||||
|
Subordinated debt
|
63,534
|
835
|
5.21
|
%
|
63,891
|
835
|
5.20
|
%
|
||||||||||||||||
|
Junior subordinated deferrable interest debentures
|
46,393
|
741
|
6.34
|
%
|
46,393
|
858
|
7.36
|
%
|
||||||||||||||||
|
Total interest-bearing liabilities
|
2,860,003
|
21,501
|
2.98
|
%
|
2,788,893
|
24,346
|
3.47
|
%
|
||||||||||||||||
|
Demand deposits
|
1,010,159
|
976,048
|
||||||||||||||||||||||
|
Other liabilities
|
67,753
|
63,661
|
||||||||||||||||||||||
|
Stockholders’ equity
|
465,938
|
430,554
|
||||||||||||||||||||||
|
Total liabilities & stockholders’ equity
|
$
|
4,403,853
|
$
|
4,259,156
|
||||||||||||||||||||
|
Net interest income
|
$
|
43,253
|
$
|
37,515
|
||||||||||||||||||||
|
Net interest margin (2)
|
4.05
|
%
|
3.65
|
%
|
||||||||||||||||||||
| (1) |
Average loan balances include nonaccrual loans and loans held for sale.
|
| (2) |
Net interest margin is calculated as the annualized net interest income, on a fully tax-equivalent basis, divided by average interest-earning assets.
|
South Plains Financial, Inc.
Average Balances and Yields - (Unaudited)
(Dollars in thousands)
|
For the Nine Months Ended
|
||||||||||||||||||||||||
|
September 30, 2025
|
September 30, 2024
|
|||||||||||||||||||||||
|
Average
Balance
|
Interest
|
Yield/Rate
|
Average
Balance
|
Interest
|
Yield/Rate
|
|||||||||||||||||||
|
Assets
|
||||||||||||||||||||||||
|
Loans (1)
|
$
|
3,087,530
|
$
|
158,406
|
6.86
|
%
|
$
|
3,055,679
|
$
|
151,031
|
6.60
|
%
|
||||||||||||
|
Debt securities - taxable
|
505,721
|
14,030
|
3.71
|
%
|
537,425
|
16,096
|
4.00
|
%
|
||||||||||||||||
|
Debt securities - nontaxable
|
153,486
|
3,109
|
2.71
|
%
|
155,489
|
3,062
|
2.63
|
%
|
||||||||||||||||
|
Other interest-bearing assets
|
444,473
|
13,707
|
4.12
|
%
|
287,192
|
10,052
|
4.68
|
%
|
||||||||||||||||
|
Total interest-earning assets
|
4,191,210
|
189,252
|
6.04
|
%
|
4,035,785
|
180,241
|
5.97
|
%
|
||||||||||||||||
|
Noninterest-earning assets
|
168,628
|
176,230
|
||||||||||||||||||||||
|
Total assets
|
$
|
4,359,838
|
$
|
4,212,015
|
||||||||||||||||||||
|
Liabilities & stockholders’ equity
|
||||||||||||||||||||||||
|
NOW, Savings, MMDA’s
|
$
|
2,318,134
|
47,408
|
2.73
|
%
|
$
|
2,251,569
|
53,792
|
3.19
|
%
|
||||||||||||||
|
Time deposits
|
435,127
|
12,406
|
3.81
|
%
|
399,646
|
12,153
|
4.06
|
%
|
||||||||||||||||
|
Short-term borrowings
|
9
|
-
|
0.00
|
%
|
3
|
-
|
0.00
|
%
|
||||||||||||||||
|
Notes payable & other long-term borrowings
|
-
|
-
|
0.00
|
%
|
-
|
-
|
0.00
|
%
|
||||||||||||||||
|
Subordinated debt
|
63,850
|
2,505
|
5.25
|
%
|
63,845
|
2,505
|
5.24
|
%
|
||||||||||||||||
|
Junior subordinated deferrable interest debentures
|
46,393
|
2,209
|
6.37
|
%
|
46,393
|
2,575
|
7.41
|
%
|
||||||||||||||||
|
Total interest-bearing liabilities
|
2,863,513
|
64,528
|
3.01
|
%
|
2,761,456
|
71,025
|
3.44
|
%
|
||||||||||||||||
|
Demand deposits
|
978,426
|
964,829
|
||||||||||||||||||||||
|
Other liabilities
|
65,835
|
68,458
|
||||||||||||||||||||||
|
Stockholders’ equity
|
452,064
|
417,272
|
||||||||||||||||||||||
|
Total liabilities & stockholders’ equity
|
$
|
4,359,838
|
$
|
4,212,015
|
||||||||||||||||||||
|
Net interest income
|
$
|
124,724
|
$
|
109,216
|
||||||||||||||||||||
|
Net interest margin (2)
|
3.98
|
%
|
3.61
|
%
|
||||||||||||||||||||
| (1) |
Average loan balances include nonaccrual loans and loans held for sale.
|
| (2) |
Net interest margin is calculated as the annualized net interest income, on a fully tax-equivalent basis, divided by average interest-earning assets.
|
South Plains Financial, Inc.
Consolidated Balance Sheets
(Unaudited)
(Dollars in thousands)
|
As of
|
||||||||
|
September 30,
2025
|
December 31,
2024
|
|||||||
|
Assets
|
||||||||
|
Cash and due from banks
|
$
|
56,071
|
$
|
54,114
|
||||
|
Interest-bearing deposits in banks
|
578,975
|
304,968
|
||||||
|
Securities available for sale
|
571,138
|
577,240
|
||||||
|
Loans held for sale
|
13,046
|
20,542
|
||||||
|
Loans held for investment
|
3,053,503
|
3,055,054
|
||||||
|
Less: Allowance for credit losses
|
(44,125
|
)
|
(43,237
|
)
|
||||
|
Net loans held for investment
|
3,009,378
|
3,011,817
|
||||||
|
Premises and equipment, net
|
51,809
|
52,951
|
||||||
|
Goodwill
|
19,315
|
19,315
|
||||||
|
Intangible assets
|
1,265
|
1,720
|
||||||
|
Mortgage servicing rights
|
24,458
|
26,292
|
||||||
|
Other assets
|
153,982
|
163,280
|
||||||
|
Total assets
|
$
|
4,479,437
|
$
|
4,232,239
|
||||
|
Liabilities and Stockholders’ Equity
|
||||||||
|
Noninterest-bearing deposits
|
$
|
1,049,501
|
$
|
935,510
|
||||
|
Interest-bearing deposits
|
2,831,642
|
2,685,366
|
||||||
|
Total deposits
|
3,881,143
|
3,620,876
|
||||||
|
Short-term borrowings
|
-
|
—
|
||||||
|
Subordinated debt
|
14,100
|
63,961
|
||||||
|
Junior subordinated deferrable interest debentures
|
46,393
|
46,393
|
||||||
|
Other liabilities
|
59,999
|
62,060
|
||||||
|
Total liabilities
|
4,001,635
|
3,793,290
|
||||||
|
Stockholders’ Equity
|
||||||||
|
Common stock
|
16,248
|
16,456
|
||||||
|
Additional paid-in capital
|
91,116
|
97,287
|
||||||
|
Retained earnings
|
421,542
|
385,827
|
||||||
|
Accumulated other comprehensive income (loss)
|
(51,104
|
)
|
(60,621
|
)
|
||||
|
Total stockholders’ equity
|
477,802
|
438,949
|
||||||
|
Total liabilities and stockholders’ equity
|
$
|
4,479,437
|
$
|
4,232,239
|
||||
South Plains Financial, Inc.
Consolidated Statements of Income
(Unaudited)
(Dollars in thousands)
|
Three Months Ended
|
Nine Months Ended
|
|||||||||||||||
|
September 30,
2025
|
September 30,
2024
|
September 30,
2025
|
September 30,
2024
|
|||||||||||||
|
Interest income:
|
||||||||||||||||
|
Loans, including fees
|
$
|
53,928
|
$
|
51,505
|
$
|
158,384
|
$
|
151,008
|
||||||||
|
Other
|
10,592
|
10,135
|
30,193
|
28,567
|
||||||||||||
|
Total interest income
|
64,520
|
61,640
|
188,577
|
179,575
|
||||||||||||
|
Interest expense:
|
||||||||||||||||
|
Deposits
|
19,925
|
22,653
|
59,814
|
65,945
|
||||||||||||
|
Subordinated debt
|
835
|
835
|
2,505
|
2,505
|
||||||||||||
|
Junior subordinated deferrable interest debentures
|
741
|
858
|
2,209
|
2,575
|
||||||||||||
|
Other
|
-
|
-
|
-
|
-
|
||||||||||||
|
Total interest expense
|
21,501
|
24,346
|
64,528
|
71,025
|
||||||||||||
|
Net interest income
|
43,019
|
37,294
|
124,049
|
108,550
|
||||||||||||
|
Provision for credit losses
|
500
|
495
|
3,420
|
3,100
|
||||||||||||
|
Net interest income after provision for credit losses
|
42,519
|
36,799
|
120,629
|
105,450
|
||||||||||||
|
Noninterest income:
|
||||||||||||||||
|
Service charges on deposits
|
2,266
|
2,023
|
6,505
|
5,785
|
||||||||||||
|
Mortgage banking activities
|
2,575
|
1,890
|
8,294
|
9,232
|
||||||||||||
|
Bank card services and interchange fees
|
3,403
|
3,302
|
10,553
|
10,415
|
||||||||||||
|
Other
|
2,921
|
3,420
|
8,603
|
9,321
|
||||||||||||
|
Total noninterest income
|
11,165
|
10,635
|
33,955
|
34,753
|
||||||||||||
|
Noninterest expense:
|
||||||||||||||||
|
Salaries and employee benefits
|
19,413
|
18,767
|
58,562
|
56,954
|
||||||||||||
|
Net occupancy expense
|
4,046
|
4,255
|
12,045
|
12,204
|
||||||||||||
|
Professional services
|
1,293
|
1,807
|
4,897
|
5,028
|
||||||||||||
|
Marketing and development
|
979
|
1,015
|
2,803
|
2,629
|
||||||||||||
|
Other
|
7,293
|
7,284
|
21,290
|
20,815
|
||||||||||||
|
Total noninterest expense
|
33,024
|
33,128
|
99,597
|
97,630
|
||||||||||||
|
Income before income taxes
|
20,660
|
14,306
|
54,987
|
42,573
|
||||||||||||
|
Income tax expense
|
4,342
|
3,094
|
11,770
|
9,353
|
||||||||||||
|
Net income
|
$
|
16,318
|
$
|
11,212
|
$
|
43,217
|
$
|
33,220
|
||||||||
South Plains Financial, Inc.
Loan Composition
(Unaudited)
(Dollars in thousands)
|
As of
|
||||||||
|
September 30,
2025
|
December 31,
2024
|
|||||||
|
Loans:
|
||||||||
|
Commercial Real Estate
|
$
|
1,035,903
|
$
|
1,119,063
|
||||
|
Commercial - Specialized
|
377,783
|
388,955
|
||||||
|
Commercial - General
|
629,256
|
557,371
|
||||||
|
Consumer:
|
||||||||
|
1-4 Family Residential
|
592,578
|
566,400
|
||||||
|
Auto Loans
|
256,281
|
254,474
|
||||||
|
Other Consumer
|
63,727
|
64,936
|
||||||
|
Construction
|
97,952
|
103,855
|
||||||
|
Total loans held for investment
|
$
|
3,053,480
|
$
|
3,055,054
|
||||
South Plains Financial, Inc.
Deposit Composition
(Unaudited)
(Dollars in thousands)
|
As of
|
||||||||
|
September 30,
2025
|
December 31,
2024
|
|||||||
|
Deposits:
|
||||||||
|
Noninterest-bearing deposits
|
$
|
1,049,501
|
$
|
935,510
|
||||
|
NOW & other transaction accounts
|
1,291,756
|
498,718
|
||||||
|
MMDA & other savings
|
1,114,945
|
1,741,988
|
||||||
|
Time deposits
|
424,941
|
444,660
|
||||||
|
Total deposits
|
$
|
3,881,143
|
$
|
3,620,876
|
||||
South Plains Financial, Inc.
Reconciliation of Non-GAAP Financial Measures (Unaudited)
(Dollars in thousands)
|
For the quarter ended
|
||||||||||||||||||||
|
September 30,
2025
|
June 30,
2025
|
March 31,
2025
|
December 31,
2024
|
September 30,
2024
|
||||||||||||||||
|
Pre-tax, pre-provision income
|
||||||||||||||||||||
|
Net income
|
$
|
16,318
|
$
|
14,605
|
$
|
12,294
|
$
|
16,497
|
$
|
11,212
|
||||||||||
|
Income tax expense
|
4,342
|
4,020
|
3,408
|
4,222
|
3,094
|
|||||||||||||||
|
Provision for credit losses
|
500
|
2,500
|
420
|
1,200
|
495
|
|||||||||||||||
|
Pre-tax, pre-provision income
|
$
|
21,160
|
$
|
21,125
|
$
|
16,122
|
$
|
21,919
|
$
|
14,801
|
||||||||||
|
As of
|
||||||||||||||||||||
|
September 30,
2025
|
June 30,
2025
|
March 31,
2025
|
December 31,
2024
|
September 30,
2024
|
||||||||||||||||
|
Tangible common equity
|
||||||||||||||||||||
|
Total common stockholders’ equity
|
$
|
477,802
|
$
|
454,074
|
$
|
$ 443,743
|
$
|
$ 438,949
|
$
|
$ 443,122
|
||||||||||
|
Less: goodwill and other intangibles
|
(20,580
|
)
|
(20,732
|
)
|
(20,884
|
)
|
(21,035
|
)
|
(21,197
|
)
|
||||||||||
|
Tangible common equity
|
$
|
457,222
|
$
|
433,342
|
$
|
$ 422,859
|
$
|
$ 417,914
|
$
|
$ 421,925
|
||||||||||
|
Tangible assets
|
||||||||||||||||||||
|
Total assets
|
$
|
4,479,437
|
$
|
4,363,674
|
$
|
$ 4,405,209
|
$
|
$ 4,232,239
|
$
|
$ 4,337,659
|
||||||||||
|
Less: goodwill and other intangibles
|
(20,580
|
)
|
(20,732
|
)
|
(20,884
|
)
|
(21,035
|
)
|
(21,197
|
)
|
||||||||||
|
Tangible assets
|
$
|
4,458,857
|
$
|
4,342,942
|
$
|
$ 4,384,325
|
$
|
$ 4,211,204
|
$
|
$ 4,316,462
|
||||||||||
|
Shares outstanding
|
16,247,839
|
16,230,475
|
16,235,647
|
16,455,826
|
16,386,627
|
|||||||||||||||
|
Total stockholders’ equity to total assets
|
10.67%
|
|
10.41%
|
|
10.07%
|
|
10.37%
|
|
10.22%
|
|
||||||||||
|
Tangible common equity to tangible assets
|
10.25%
|
|
9.98%
|
|
9.64%
|
|
9.92%
|
|
9.77%
|
|
||||||||||
|
Book value per share
|
$
|
29.41
|
$
|
27.98
|
$
|
27.33
|
$
|
26.67
|
$
|
27.04
|
||||||||||
|
Tangible book value per share
|
$
|
28.14
|
$
|
26.70
|
$
|
26.05
|
$
|
25.40
|
$
|
25.75
|
||||||||||
Exhibit 99.2