UNITED STATES
SECURITIES AND EXCHANGE COMMISSION
Washington, D.C. 20549
FORM 8-K
CURRENT REPORT
Pursuant to Section 13 or 15(d) of
the Securities Exchange Act of 1934
Date of Report (Date of earliest event reported): July 29, 2020
South Plains Financial, Inc.
(Exact name of registrant as specified in its charter)
|
Texas
|
001-38895
|
75-2453320
|
|
(State or other jurisdiction of incorporation)
|
(Commission File Number)
|
(IRS Employer Identification No.)
|
|
5219 City Bank Parkway Lubbock, Texas
|
79407
|
|
|
(Address of principal executive offices)
|
(Zip Code)
|
(806) 792-7101
(Registrant’s telephone number, including area code)
Check the appropriate box below if the Form 8-K filing is intended to simultaneously satisfy the filing obligation of the registrant under any of the following provisions:
| ☐ |
Written communications pursuant to Rule 425 under the Securities Act (17 CFR 230.425)
|
| ☐ |
Soliciting material pursuant to Rule 14a-12 under the Exchange Act (17 CFR 240.14a-12)
|
| ☐ |
Pre-commencement communications pursuant to Rule 14d-2(b) under the Exchange Act (17 CFR 240.14d-2(b))
|
| ☐ |
Pre-commencement communications pursuant to Rule 13e-4(c) under the Exchange Act (17 CFR 240.13e-4(c))
|
Securities registered pursuant to Section 12(b) of the Act:
|
Title of each class
|
Trading Symbol(s)
|
Name of each exchange on which registered
|
|
Common Stock, par value $1.00 per share
|
SPFI
|
The Nasdaq Stock Market LLC
|
Indicate by check mark whether the registrant is an emerging growth company as defined in Rule 405 of the Securities Act of 1933 (§230.405 of this chapter) or Rule 12b-2 of the Securities Exchange Act of 1934 (§240.12b-2 of this chapter).
Emerging growth company ☒
If an emerging growth company, indicate by check mark if the registrant has elected not to use the extended transition period for complying with any new or revised financial accounting standards provided pursuant to Section
13(a) of the Exchange Act. ☐
| Item 2.02 |
Results of Operations and Financial Condition.
|
On July 29, 2020, South Plains Financial, Inc. (the “Company”) issued a press release
announcing its financial results for the second quarter ended June 30, 2020. A copy of the Company’s press release covering such announcement and certain other matters is furnished as Exhibit 99.1 to this Current Report on Form 8-K.
| Item 7.01 |
Regulation FD Disclosure.
|
On July 29, 2020, officers of the Company will have a conference call with respect to the Company’s financial results for the second quarter ended June 30, 2020. An earnings release slide
presentation highlighting the Company’s financial results for the second quarter ended June 30, 2020 is furnished as Exhibit 99.2 to this Current Report on Form 8-K. This earnings release slide presentation will also be available on the Company’s
website, www.spfi.bank, under the “News & Events” section.
In accordance with General Instruction B.2 of Form 8-K, the information in Item 2.02 and 7.01 of this Current Report on Form 8-K, including Exhibit 99.1 and Exhibit 99.2 herto, shall not be deemed
“filed” for the purposes of Section 18 of the Securities Exchange Act of 1934, as amended, or otherwise subject to the liabilities of that section. The information in Item 2.02 and 7.01 of this Current Report on Form 8-K, including Exhibit 99.1
and Exhibit 99.2 hereto, shall not be incorporated by reference into any filing or other document pursuant to the Securities Act of 1933, as amended, except as shall be expressly set forth by specific reference in such filing or document.
| Item 9.01 |
Financial Statements and Exhibits.
|
| (d) |
Exhibits.
|
| 99.1 |
Press release, dated July 29, 2020, announcing second quarter 2020 financial results of South Plains Financial, Inc.
|
| 99.2 |
Earnings release slide presentation, dated July 29, 2020
|
SIGNATURES
Pursuant to the requirements of the Securities Exchange Act of 1934, the registrant has duly caused this report to be signed on its behalf by the undersigned hereunto duly authorized.
|
SOUTH PLAINS FINANCIAL, INC.
|
||
|
Dated: July 29, 2020
|
By:
|
/s/ Curtis C. Griffith
|
|
Curtis C. Griffith
|
||
|
Chairman and Chief Executive Officer
|
||
Exhibit 99.1
 |
South Plains Financial, Inc. Reports Second Quarter 2020 Financial Results
LUBBOCK, Texas, July 29, 2020 (GLOBE NEWSWIRE) – South Plains Financial, Inc. (NASDAQ:SPFI) (“South Plains” or the “Company”), the parent company of City Bank (“City Bank” or the “Bank”), today reported
its financial results for the quarter ended June 30, 2020.
Second Quarter 2020 Highlights
| ● |
Net income for the second quarter of 2020 was $5.6 million, compared to $7.1 million for the first quarter of 2020 and $6.1 million for the second quarter of 2019.
|
| ● |
Diluted earnings per share for the second quarter of 2020 was $0.31, compared to $0.38 for the first quarter of 2020 and $0.37 for the second quarter of 2019.
|
| ● |
Pre-tax, pre-provision income (non-GAAP) for the second quarter of 2020 was $20.1 million, compared to $15.1 million for the first quarter of 2020 and $8.6 million for the second quarter of 2019.
|
| ● |
Average cost of deposits for the second quarter of 2020 decreased to 39 basis points, compared to 65 basis points for the first quarter of 2020 and 108 basis points for the second quarter of 2019.
|
| ● |
The provision for loan losses for the second quarter of 2020 was $13.1 million, compared to $6.2 million for the first quarter of 2020 and $875,000 for the second quarter of 2019. The increase in the provision
during the second quarter of 2020 was primarily due to management’s expectations regarding the continued economic downturn related to the ongoing COVID-19 pandemic, the volatility in energy prices and reduced oil production in the State of
Texas.
|
| ● |
Nonperforming assets to total assets were 0.33% at June 30, 2020, compared to 0.28% as of March 31, 2020 and 0.37% at June 30, 2019.
|
| ● |
The adjusted (non-GAAP) efficiency ratio for the second quarter of 2020 was 63.28%, compared to 72.52% for the first quarter of 2020 and 77.46% for the second quarter of 2019.
|
| ● |
Return on average assets for the second quarter of 2020 was 0.64% annualized, compared to 0.89% annualized for the first quarter of 2020 and 0.89% annualized for the second quarter of 2019.
|
| ● |
Book value per share was $18.64 as of June 30, 2020, compared to $18.10 per share as of March 31, 2020 and $16.19 per share as of June 30, 2019.
|
Curtis Griffith, South Plains’ Chairman and Chief Executive Officer, commented, “I am very proud of our employees for their hard work and dedication to our customers and communities during this
unprecedented time. They have kept the Bank’s operations running smoothly and maintained a high level of service and support for our customers. As the number of COVID-19 cases started to spike in Texas in June, we made the decision to close our
branch lobbies once again to appointment-only service while keeping our drive-through windows in operation. Overall, we continue to operate very effectively through our drive-through windows and are successfully transitioning our customers to our
digital banking platforms. Importantly, we have invested in the technology and developed the digital platforms and systems which have allowed us to effectively service our customers remotely throughout the ongoing COVID-19 pandemic. We will also
remain disciplined on expenses and are adapting our branch network to more effectively meet customer traffic trends, which remain robust. As part of this, we closed our Springlake, Texas branch at the end of June and will continue to focus on doing
more with less.”
Mr. Griffith continued, “While the economic backdrop was a headwind to our second quarter results, I am very pleased with our performance and the earnings growth that is building within the Bank. For the second quarter of
2020, we delivered pre-tax, pre-provision income of $20.1 million, which compares favorably to the $15.1 million achieved in the first quarter of 2020 and the $8.6 million in the year ago second quarter. We recorded a $13.1 million provision
expense during the second quarter of 2020, driven largely by qualitative factors based upon what we are seeing in our local economies and the potential extended impact of the COVID-19 pandemic. We have taken a very proactive approach to this crisis
with all of our borrowers, especially in our at-risk categories of the loan portfolio, including our borrowers in the hospitality and energy segments. We are encouraged with the flattening of our loan modifications at 19.9% of the total loan
portfolio at June 30, 2020. We believe our aggressive provision this quarter reflects a conservative outlook at the end of the second quarter and we believe that we have the capital to absorb the losses in our loan portfolio that could result from
an adverse stress environment. Looking forward, we feel well positioned to take advantage of opportunities that could be created in these difficult times.”
COVID-19 Update
The Company’s Oversight Committee for Business Continuity and Incident Response, which has monitored the spread of the coronavirus since January, continues to monitor the impact of the ongoing COVID-19
pandemic, as well as employee and customer communications. The Company’s Pandemic Task Force continues to implement South Plains’ Business Continuity Plan, focusing on the safety of the Company’s employees and customers while maintaining the
operational and financial integrity of the Bank. Non-essential employees were transitioned to a work-from-home environment, strict protocols for employees deemed essential were adopted to ensure adequate social distancing and all Bank facilities are
receiving incremental cleaning and sanitization. The Company restricted access to its bank lobbies and customers are currently served through appointments only, as well as through the Bank’s drive-through windows and recently upgraded digital
platforms.
The Bank also continues to implement a rigorous enterprise risk management (“ERM”) system that delivers a systematic approach to risk measurement and enhances the effectiveness of risk management across
the Bank. The Bank’s ERM system has allowed management to consistently and aggressively review the Bank’s loan portfolio for signs of potential issues during the ongoing COVID-19 pandemic and the Bank continues to closely monitoring its loans to
borrowers in the retail, hospitality and energy sectors.
While the duration of the COVID-19 pandemic and the scope of its impact on the economy is uncertain, the Bank continues to be proactive with its borrowers in those sectors most affected by the COVID-19
pandemic and offering loan modifications to borrowers who are or may be unable to meet their contractual payment obligations because of the effects of COVID-19. As previously disclosed, the Bank has assigned its Chairman, Chief Executive Officer,
Chief Credit Officer and Chief Lending Officer to partner with the Bank’s lenders on those borrowers most impacted by the COVID-19 pandemic to ensure the Company remains proactive in addressing those credits with the appropriate oversight and
modifications when warranted. As part of the Bank’s efforts to support its customers and protect the Bank, the Bank has offered varying forms of loan modifications ranging from 90-day payment deferrals to 6- to 12-month interest only terms to provide
borrowers relief. As of June 30, 2020, total loan modifications attributed to COVID-19 were approximately $464 million, or 19.9%, of the Company’s loan portfolio. The modification breakdown is: 64% of modified loans are interest only with periods of
up to 6 months, 15% of modified loans are 90 day payment deferrals on commercial customers, 10% of modified loans are interest only periods longer than 6 months, primarily in the Bank’s hotel portfolio, and 11% of modified loans are payment deferrals
of one to four months on consumer loans.
The Bank has assisted its customers in accessing the Paycheck Protection Program (the “PPP”) administered by the Small Business Administration (the “SBA”) and created under the Coronavirus Aid, Relief,
and Economic Security Act (the “CARES Act”). During the second quarter of 2020, the Bank originated approximately 2,050 PPP loans totaling $215 million. The Bank has utilized its lines of credit with the Federal Home Loan Bank of Dallas and/or the
Federal Reserve Bank to supplement funding for origination of PPP loans as needed. Helping City Bank’s customers access PPP loans is just one way that the Bank has been helping its customers and communities during this challenging time. City Bank has
also been a supporter of the South Plains and Permian Basin food banks and recently increased its financial support given the challenging economic environment for so many.
Finally, as previously announced on April 16, 2020, the Company temporarily suspended its stock repurchase program in response to the ongoing COVID-19 pandemic. Suspending the stock repurchase program
has allowed the Company to preserve capital and provide liquidity to meet the credit needs of the customers, small businesses and local communities served by the Company and City Bank. The Company believes that it remains strong and well-capitalized,
and the Company may reinstate the stock repurchase program in the future.
Results of Operations, Quarter Ended June 30, 2020
Net Interest Income
Net interest income was $30.4 million for the second quarter of 2020, compared to $24.8 million for the second quarter of 2019 and $30.2 million for the first quarter of 2020.
Interest income was $34.0 million for the second quarter of 2020, compared to $32.5 million for the second quarter of 2019 and $35.7 million for the first quarter of 2020. Interest and fees on loans
increased by $1.3 million from the second quarter of 2019 due to growth of $429.1 million in average loans, primarily from the Company’s acquisition of West Texas State Bank (“WTSB”) as well as the PPP loans that were originated in the second quarter
of 2020, partially offset by a decrease of 64 basis points in non-PPP loan rates due to the decline in the interest rate environment experienced in the first quarter of 2020. The decrease from the first quarter of 2020 was principally the result of a
decrease of 50 basis points in non-PPP loan rates, partially offset by an increase of $208.7 million in average loans outstanding during the second quarter of 2020. The increase in average loans was largely attributable to the new PPP loans
originated in the second quarter of 2020 as well as normal seasonal funding of the Bank’s agricultural production loans. The PPP loans yielded 2.53% during the second quarter of 2020, which includes accretion of the related SBA lenders fees for
processing PPP loans during the quarter. As of June 30, 2020, the Company has received and deferred $7.7 million in PPP related SBA fees and is accreting these fees into interest income over the life of the applicable loans. If a PPP loan is forgiven
or paid off before maturity, the remaining unamortized fee is accreted to income at that time. During the second quarter of 2020, the Company recognized $641,000 million in PPP related SBA fees. The Company expects that the majority of PPP loans will
begin to be forgiven over the next several quarters.
Interest expense was $3.6 million for the second quarter of 2020, compared to $7.7 million for the second quarter of 2019 and $5.5 million for the first quarter of 2020. The decrease from the second
quarter of 2019 was primarily due to a decrease in the interest rate paid on interest-bearing liabilities of 94 basis points, partially offset by an increase of $281.7 million in average interest-bearing liabilities. The decrease from the first
quarter of 2020 was primarily due to a decrease in the interest rate paid on interest-bearing liabilities of 42 basis points, partially offset by an increase of $127.9 million in average interest-bearing liabilities in the second quarter of 2020. The
average cost of deposits was 39 basis points for the second quarter of 2020, representing a 69 basis point decrease from the second quarter of 2019 and a 26 basis point decrease from the first quarter of 2020. The increase in average interest-bearing
liabilities in the second quarter of 2020 compared to the first quarter of 2020 was primarily due to increased deposits, from PPP loan funding and other government stimulus payments and programs as well as organic growth, and an additional $75.0
million in borrowings to augment liquidity in funding the PPP loans. The increase compared to the second quarter of 2019 was largely due to the Company’s acquisition of WTSB as well as the other deposit growth noted above. Additionally, the decrease
in the rate paid on interest-bearing liabilities was the result of the decline in the overall rate environment experienced in the first quarter of 2020.
The net interest margin was 3.79% for the second quarter of 2020, compared to 3.88% for the second quarter of 2019 and 4.13% for the first quarter of 2020. The origination of PPP loans accounted for an
estimated 11 basis points of the decrease of net interest margin. An estimated additional 7 basis points of the decrease in net interest margin is attributable to a reduction in purchased loan income accretion.
Noninterest Income and Noninterest Expense
Noninterest income was $24.9 million for the second quarter of 2020, compared to $13.7 million for the second quarter of 2019 and $18.9 million for the first quarter of 2020. The increase in noninterest
income for the second quarter of 2020 compared to the second quarter of 2019 was primarily the result of an increase of $11.3 million in mortgage banking activities revenue due to an increase of $225.8 million in mortgage loan originations.
Additionally, there was a decrease in service charges on deposits of $540,000 in the second quarter of 2020 from reduced customer spending and activity during the ongoing COVID-19 pandemic. The increase from the first quarter of 2020 was primarily
the result of an increase of $9.2 million in mortgage banking activities revenue as a result of an increase of $152.6 million in mortgage loan originations, partially offset by a $2.3 million gain on sale of securities recorded in the first quarter
of 2020. Additionally, there was a decrease in service charges on deposits of $544,000 in the second quarter of 2020.
Noninterest expense was $35.2 million for the second quarter of 2020, compared to $29.9 million for the second quarter of 2019 and $34.0 million for the first quarter of 2020. This increase in
noninterest expense for the second quarter of 2020 compared to the second quarter of 2019 was primarily driven by a $2.8 million increase in personnel expense. This increase was predominately related to an additional $2.6 million in commissions paid
on the higher volume of mortgage loan originations and personnel in the Bank’s branches in the Permian Basin that were acquired in the fourth quarter of 2019 through the Company’s acquisition of WTSB, partially offset by a reduction in the Bank’s
online mortgage platform personnel and other efficiency enhancements. There was also an increase in variable mortgage expenses, such as appraisal expenses, due to the increased mortgage production during the quarter. Other noninterest expenses also
increased due to the acquisition of WTSB, including occupancy and other noninterest expenses for the branches acquired and core deposit intangible amortization expense. The increase from the first quarter of 2020 was primarily the result of an
additional $2.2 million in commissions and higher other variable expenses as a result of increased mortgage production, partially offset by higher expenses in the first quarter of 2020 for data conversion expenses and computer equipment purchased in
connection with upgrading the equipment at the acquired branches as well as at existing branches.
Loan Portfolio and Composition
Loans held for investment were $2.33 billion as of June 30, 2020, compared to $2.11 billion as of March 31, 2020 and $1.94 billion as of June 30, 2019. The $222.9 million increase during the second
quarter of 2020 as compared to the first quarter of 2020 was primarily the result of the Bank’s origination of $215.3 million in PPP loans and $34.7 million in seasonal funding on agricultural loans, partially offset by paydowns of $13.1 million in
non-residential consumer loans and $11.3 million in direct energy loans. As of June 30, 2020, loans held for investment increased $396.1 million from June 30, 2019, largely attributable to the PPP loans and the WTSB acquisition in the fourth quarter
of 2019.
Agricultural production loans were $131.5 million as of June 30, 2020, compared to $96.8 million as of March 31, 2020 and $147.7 million as of June 30, 2019.
Deposits and Borrowings
Deposits totaled $2.95 billion as of June 30, 2020, compared to $2.67 billion as of March 31, 2020 and $2.28 billion as of June 30, 2019. Deposits increased $282.0 million in the second quarter of 2020,
compared to the first quarter of 2020, primarily as a result of organic growth, customers depositing PPP loan proceeds, and other government stimulus payments and programs. As of June 30, 2020, deposits increased $666.0 million from June 30, 2019.
The increase in deposits since June 30, 2019 is primarily a result of the increases noted above as well as the assumption of deposits from the WTSB acquisition in the fourth quarter of 2019.
Noninterest-bearing deposits were $940.9 million as of June 30, 2020, compared to $740.9 million as of March 31, 2020 and $513.4 million as of June 30, 2019. Noninterest-bearing deposits represented
31.9%, 27.8%, and 22.5% of total deposits as of June 30, 2020, March 31, 2020, and June 30, 2019, respectively. The increases in noninterest-bearing deposit balances at June 30, 2020 compared to the other periods is the same as detailed above.
Asset Quality
The provision for loan losses recorded for the second quarter of 2020 was $13.1 million, compared to $875,000 for the second quarter of 2019 and $6.2 million for the first quarter of 2020. The increase
in the provision for loan losses in the second quarter of 2020 compared to the second quarter of 2019 is a result of economic effects from COVID-19 as well as the decline in oil and gas prices that started in the first quarter of 2019. The increase
in the provision for loan losses in the second quarter of 2020 compared to the first quarter of 2020 is a result of a further worsening of the economy and continued uncertainty from COVID-19. The full extent of the impact on the economy and the
Bank’s customers is unknown at this time. Accordingly, additional provisions for loan losses may be necessary in future periods.
The allowance for loan losses to loans held for investment was 1.74% as of June 30, 2020, compared to 1.38% as of March 31, 2020 and 1.25% as of June 30, 2019. The allowance for loan losses to non-PPP
loans held for investment was 1.91% as of June 30, 2020.
The nonperforming assets to total assets ratio as of June 30, 2020 was 0.33%, compared to 0.28% as of March 31, 2020 and 0.37% at June 30, 2019.
Annualized net charge-offs were 0.27% for the second quarter of 2020, compared to 0.25% for the first quarter of 2020 and 0.02% for the second quarter of 2019.
Conference Call
South Plains will host a conference call to discuss its second quarter 2020 financial results today, July 29, 2020 at 5:00 p.m., Eastern Time. Investors and analysts interested in participating in the
call are invited to dial 1-877-407-9716 (international callers please dial 1-201-493-6779) approximately 10 minutes prior to the start of the call. A live audio webcast of the conference call and conference materials will be available on the
Company’s website at https://www.spfi.bank/news-events/events.
A replay of the conference call will be available within two hours of the conclusion of the call and can be accessed on the investor section of the Company’s website as well as by dialing 1-844-512-2921
(international callers please dial 1-412-317-6671). The pin to access the telephone replay is 13706046. The replay will be available until August 12, 2020.
About South Plains Financial, Inc.
South Plains is the bank holding company for City Bank, a Texas state-chartered bank headquartered in Lubbock, Texas. City Bank is one of the largest independent banks in West Texas and has additional banking operations in
the Dallas, El Paso, Greater Houston, the Permian Basin, and College Station Texas markets, and the Ruidoso and Eastern New Mexico markets. South Plains provides a wide range of commercial and consumer financial services to small and medium-sized
businesses and individuals in its market areas. Its principal business activities include commercial and retail banking, along with insurance, investment, trust and mortgage services. Please visit https://www.spfi.bank for more information.
Non-GAAP Financial Measures
Some of the financial measures included in this press release are not measures of financial performance recognized in accordance with generally accepted accounting principles in the United States
(“GAAP”). These non-GAAP financial measures include Tangible Book Value Per Common Share, Tangible Common Equity to Tangible Assets, Adjusted Efficiency Ratio, and Pre-Tax, Pre-Provision Income. The Company believes these non-GAAP financial measures
provide both management and investors a more complete understanding of the Company’s financial position and performance. These non-GAAP financial measures are supplemental and are not a substitute for any analysis based on GAAP financial measures.
We classify a financial measure as being a non-GAAP financial measure if that financial measure excludes or includes amounts, or is subject to adjustments that have the effect of excluding or including
amounts, that are included or excluded, as the case may be, in the most directly comparable measure calculated and presented in accordance with GAAP as in effect from time to time in the United States in our statements of income, balance sheets or
statements of cash flows. Not all companies use the same calculation of these measures; therefore, this presentation may not be comparable to other similarly titled measures as presented by other companies.
A reconciliation of non-GAAP financial measures to GAAP financial measures is provided at the end of this press release.
Available Information
The Company routinely posts important information for investors on its web site (under www.spfi.bank and, more specifically, under the News & Events
tab at www.spfi.bank/news-events/press-releases). The Company intends to use its web site as a means of disclosing material non-public information and for complying with its disclosure obligations under SEC Regulation FD (Fair Disclosure)
promulgated by the U.S. Securities and Exchange Commission (the “SEC”). Accordingly, investors should monitor the Company’s web site, in addition to following the Company’s press releases, SEC filings, public conference calls, presentations and
webcasts.
The information contained on, or that may be accessed through, the Company’s web site is not incorporated by reference into, and is not a part of, this document.
Forward Looking Statements
This press release contains forward-looking statements. These forward-looking statements reflect South Plains’ current views with respect to, among other things, the ongoing COVID-19 pandemic and other
future events. Any statements about South Plains’ expectations, beliefs, plans, predictions, forecasts, objectives, assumptions or future events or performance are not historical facts and may be forward-looking. These statements are often, but not
always, made through the use of words or phrases such as “anticipate,” “believes,” “can,” “could,” “may,” “predicts,” “potential,” “should,” “will,” “estimate,” “plans,” “projects,” “continuing,” “ongoing,” “expects,” “intends” and similar words or
phrases. South Plains cautions that the forward-looking statements in this press release are based largely on South Plains’ expectations and are subject to a number of known and unknown risks and uncertainties that are subject to change based on
factors which are, in many instances, beyond South Plains’ control. Factors that could cause such changes include, but are not limited to, general economic conditions, the extent of the impact of the COVID-19 pandemic on our customers, changes in
interest rates, regulatory considerations, competition and market expansion opportunities, changes in non-interest expenditures or in the anticipated benefits of such expenditures, and changes in applicable laws and regulations. Additional
information regarding these risks and uncertainties to which South Plains’ business and future financial performance are subject is contained in South Plains’ most recent Quarterly Report on Form 10-Q on file with the Securities and Exchange
Comission (the “SEC”), and other documents South Plains files with the SEC from time to time. South Plains urges readers of this press release to review the “Risk Factors” section of our most recent Annual
Report on Form 10-K Quarterly Report on Form 10-Q, as well as the “Risk Factors” section of other documents South Plains files with the SEC from time to time. Actual results, performance or achievements could
differ materially from those contemplated, expressed, or implied by the forward-looking statements due to additional risks and uncertainties of which South Plains is not currently aware or which it does not currently view as, but in the future may
become, material to its business or operating results. Due to these and other possible uncertainties and risks, readers are cautioned not to place undue reliance on the forward-looking statements contained in this press release. Any forward-looking
statements presented herein are made only as of the date of this press release, and South Plains does not undertake any obligation to update or revise any forward-looking statements to reflect changes in assumptions, new information, the occurrence
of unanticipated events, or otherwise, except as required by law.
|
Contact:
|
Mikella Newsom, Chief Risk Officer and Secretary
|
|
(866) 771-3347
|
|
Source: South Plains Financial, Inc.
South Plains Financial, Inc.
Consolidated Financial Highlights - (Unaudited)
(Dollars in thousands, except share data)
|
As of and for the quarter ended
|
||||||||||||||||||||
|
June 30,
2020
|
March 31,
2020
|
December 31,
2019
|
September 30,
2019
|
June 30,
2019
|
||||||||||||||||
|
Selected Income Statement Data:
|
||||||||||||||||||||
|
Interest income
|
$
|
34,007
|
$
|
35,737
|
$
|
34,764
|
$
|
33,665
|
$
|
32,509
|
||||||||||
|
Interest expense
|
3,559
|
5,538
|
6,140
|
7,097
|
7,672
|
|||||||||||||||
|
Net interest income
|
30,448
|
30,199
|
28,624
|
26,568
|
24,837
|
|||||||||||||||
|
Provision for loan losses
|
13,133
|
6,234
|
896
|
420
|
875
|
|||||||||||||||
|
Noninterest income
|
24,896
|
18,875
|
16,740
|
14,115
|
13,703
|
|||||||||||||||
|
Noninterest expense
|
35,207
|
34,011
|
31,714
|
30,028
|
29,930
|
|||||||||||||||
|
Income tax expense
|
1,389
|
1,746
|
2,645
|
1,977
|
1,655
|
|||||||||||||||
|
Net income
|
5,615
|
7,083
|
10,109
|
8,258
|
6,080
|
|||||||||||||||
|
Per Share Data (Common Stock):
|
||||||||||||||||||||
|
Net earnings, basic
|
0.31
|
0.39
|
0.56
|
0.46
|
0.37
|
|||||||||||||||
|
Net earnings, diluted
|
0.31
|
0.38
|
0.55
|
0.45
|
0.37
|
|||||||||||||||
|
Cash dividends declared and paid
|
0.03
|
0.03
|
0.03
|
0.03
|
-
|
|||||||||||||||
|
Book value
|
18.64
|
18.10
|
16.98
|
16.61
|
16.19
|
|||||||||||||||
|
Tangible book value
|
17.06
|
16.54
|
15.46
|
16.47
|
16.19
|
|||||||||||||||
|
Weighted average shares outstanding, basic
|
18,061,705
|
18,043,105
|
18,010,065
|
17,985,429
|
16,459,366
|
|||||||||||||||
|
Weighted average shares outstanding, dilutive
|
18,224,630
|
18,461,922
|
18,415,656
|
18,363,033
|
16,563,543
|
|||||||||||||||
|
Shares outstanding at end of period
|
18,059,174
|
18,056,014
|
18,036,115
|
18,004,323
|
17,978,520
|
|||||||||||||||
|
Selected Period End Balance Sheet Data:
|
||||||||||||||||||||
|
Cash and cash equivalents
|
256,101
|
136,062
|
158,099
|
244,645
|
408,116
|
|||||||||||||||
|
Investment securities
|
730,674
|
734,791
|
707,650
|
401,335
|
263,564
|
|||||||||||||||
|
Total loans held for investment
|
2,331,716
|
2,108,805
|
2,143,623
|
1,962,609
|
1,935,653
|
|||||||||||||||
|
Allowance for loan losses
|
40,635
|
29,074
|
24,197
|
24,176
|
24,171
|
|||||||||||||||
|
Total assets
|
3,584,532
|
3,216,563
|
3,237,167
|
2,795,582
|
2,777,170
|
|||||||||||||||
|
Interest-bearing deposits
|
2,006,984
|
1,924,902
|
1,905,936
|
1,729,741
|
1,768,475
|
|||||||||||||||
|
Noninterest-bearing deposits
|
940,853
|
740,946
|
790,921
|
556,233
|
513,383
|
|||||||||||||||
|
Total deposits
|
2,947,837
|
2,665,848
|
2,696,857
|
2,285,974
|
2,281,858
|
|||||||||||||||
|
Borrowings
|
252,430
|
185,265
|
205,030
|
177,720
|
176,675
|
|||||||||||||||
|
Total stockholders’ equity
|
336,534
|
326,890
|
306,182
|
299,027
|
291,113
|
|||||||||||||||
|
Summary Performance Ratios:
|
||||||||||||||||||||
|
Return on average assets
|
0.64
|
%
|
0.89
|
%
|
1.32
|
%
|
1.18
|
%
|
0.89
|
%
|
||||||||||
|
Return on average equity
|
6.81
|
%
|
9.00
|
%
|
13.25
|
%
|
11.10
|
%
|
9.57
|
%
|
||||||||||
|
Net interest margin (1)
|
3.79
|
%
|
4.13
|
%
|
4.03
|
%
|
4.07
|
%
|
3.88
|
%
|
||||||||||
|
Yield on loans
|
5.26
|
%
|
5.76
|
%
|
5.79
|
%
|
5.91
|
%
|
5.90
|
%
|
||||||||||
|
Cost of interest-bearing deposits
|
0.56
|
%
|
0.91
|
%
|
1.06
|
%
|
1.30
|
%
|
1.39
|
%
|
||||||||||
|
Efficiency ratio
|
63.28
|
%
|
69.10
|
%
|
69.71
|
%
|
73.62
|
%
|
77.46
|
%
|
||||||||||
|
Summary Credit Quality Data:
|
||||||||||||||||||||
|
Nonperforming loans
|
10,472
|
7,112
|
6,045
|
6,456
|
7,946
|
|||||||||||||||
|
Nonperforming loans to total loans held for investment
|
0.45
|
%
|
0.34
|
%
|
0.28
|
%
|
0.33
|
%
|
0.41
|
%
|
||||||||||
|
Other real estate owned
|
1,335
|
1,944
|
1,883
|
2,296
|
2,305
|
|||||||||||||||
|
Nonperforming assets to total assets
|
0.33
|
%
|
0.28
|
%
|
0.24
|
%
|
0.31
|
%
|
0.37
|
%
|
||||||||||
|
Allowance for loan losses to total loans held for investment
|
1.74
|
%
|
1.38
|
%
|
1.13
|
%
|
1.23
|
%
|
1.25
|
%
|
||||||||||
|
Net charge-offs to average loans outstanding (annualized)
|
0.27
|
%
|
0.25
|
%
|
0.17
|
%
|
0.08
|
%
|
0.02
|
%
|
||||||||||
|
As of and for the quarter ended
|
||||||||||||||||||||
|
June 30,
2020
|
March 31,
2020
|
December 31,
2019
|
September 30,
2019
|
June 30,
2019
|
||||||||||||||||
|
Capital Ratios:
|
||||||||||||||||||||
|
Total stockholders’ equity to total assets
|
9.39
|
%
|
10.16
|
%
|
9.46
|
%
|
10.70
|
%
|
10.48
|
%
|
||||||||||
|
Tangible common equity to tangible assets
|
8.66
|
%
|
9.37
|
%
|
8.69
|
%
|
10.62
|
%
|
10.48
|
%
|
||||||||||
|
Common equity tier 1 to risk-weighted assets
|
10.51
|
%
|
11.24
|
%
|
11.06
|
%
|
13.10
|
%
|
13.31
|
%
|
||||||||||
|
Tier 1 capital to average assets
|
9.60
|
%
|
10.34
|
%
|
10.74
|
%
|
12.17
|
%
|
12.10
|
%
|
||||||||||
|
Total capital to risk-weighted assets
|
14.36
|
%
|
15.23
|
%
|
14.88
|
%
|
17.38
|
%
|
17.75
|
%
|
||||||||||
| (1) |
Net interest margin is calculated as the annual net interest income, on a fully tax-equivalent basis, divided by average interest-earning assets.
|
South Plains Financial, Inc.
Average Balances and Yields - (Unaudited)
(Dollars in thousands)
|
For the Three Months Ended
|
||||||||||||||||||||||||
|
June 30, 2020
|
June 30, 2019
|
|||||||||||||||||||||||
|
Average
Balance
|
Interest
Income
Expense
|
Yield
|
Average
Balance
|
Interest
Income
Expense
|
Yield
|
|||||||||||||||||||
|
Assets
|
||||||||||||||||||||||||
|
Loans, excluding PPP (1)
|
$
|
2,204,441
|
$
|
28,825
|
5.26
|
%
|
$
|
1,946,602
|
$
|
28,635
|
5.90
|
%
|
||||||||||||
|
Loans - PPP
|
171,304
|
1,076
|
2.53
|
%
|
-
|
-
|
0.00
|
%
|
||||||||||||||||
|
Debt securities - taxable
|
547,971
|
3,080
|
2.26
|
%
|
248,915
|
1,754
|
2.83
|
%
|
||||||||||||||||
|
Debt securities - nontaxable
|
160,142
|
1,192
|
2.99
|
%
|
31,387
|
275
|
3.51
|
%
|
||||||||||||||||
|
Other interest-bearing assets
|
174,753
|
124
|
0.29
|
%
|
348,106
|
1,946
|
2.24
|
%
|
||||||||||||||||
|
Total interest-earning assets
|
3,258,611
|
34,297
|
4.23
|
%
|
2,575,010
|
32,610
|
5.08
|
%
|
||||||||||||||||
|
Noninterest-earning assets
|
249,571
|
174,944
|
||||||||||||||||||||||
|
Total assets
|
$
|
3,508,182
|
$
|
2,749,954
|
||||||||||||||||||||
|
Liabilities & stockholders’ equity
|
||||||||||||||||||||||||
|
NOW, Savings, MMA’s
|
$
|
1,650,159
|
1,330
|
0.32
|
%
|
$
|
1,449,169
|
4,696
|
1.30
|
%
|
||||||||||||||
|
Time deposits
|
326,561
|
1,430
|
1.76
|
%
|
317,323
|
1,443
|
1.82
|
%
|
||||||||||||||||
|
Short-term borrowings
|
16,449
|
6
|
0.15
|
%
|
11,085
|
57
|
2.06
|
%
|
||||||||||||||||
|
Notes payable & other long-term borrowings
|
161,099
|
96
|
0.24
|
%
|
95,000
|
561
|
2.37
|
%
|
||||||||||||||||
|
Subordinated debt securities
|
26,472
|
403
|
6.12
|
%
|
26,472
|
403
|
6.11
|
%
|
||||||||||||||||
|
Junior subordinated deferrable interest debentures
|
46,393
|
294
|
2.55
|
%
|
46,393
|
512
|
4.43
|
%
|
||||||||||||||||
|
Total interest-bearing liabilities
|
2,227,133
|
3,559
|
0.64
|
%
|
1,945,442
|
7,672
|
1.58
|
%
|
||||||||||||||||
|
Demand deposits
|
901,761
|
516,783
|
||||||||||||||||||||||
|
Other liabilities
|
47,576
|
32,890
|
||||||||||||||||||||||
|
Stockholders’ equity
|
331,712
|
254,839
|
||||||||||||||||||||||
|
Total liabilities & stockholders’ equity
|
$
|
3,508,182
|
$
|
2,749,954
|
||||||||||||||||||||
|
Net interest income
|
$
|
30,738
|
$
|
24,938
|
||||||||||||||||||||
|
Net interest margin (2)
|
3.79
|
%
|
3.88
|
%
|
||||||||||||||||||||
| (1) |
Average loan balances include nonaccrual loans and loans held for sale.
|
| (2) |
Net interest margin is calculated as the annualized net income, on a fully tax-equivalent basis, divided by average interest-earning assets.
|
South Plains Financial, Inc.
Average Balances and Yields - (Unaudited)
(Dollars in thousands)
|
For the Six Months Ended
|
||||||||||||||||||||||||
|
June 30, 2020
|
June 30, 2019
|
|||||||||||||||||||||||
|
Average
Balance
|
Interest
Income
Expense
|
Yield
|
Average
Balance
|
Interest
Income
Expense
|
Yield
|
|||||||||||||||||||
|
Assets
|
||||||||||||||||||||||||
|
Loans, excluding PPP (1)
|
$
|
2,185,728
|
$
|
59,879
|
5.51
|
%
|
$
|
1,951,193
|
$
|
56,776
|
5.87
|
%
|
||||||||||||
|
Loans - PPP
|
85,652
|
1,076
|
2.53
|
%
|
-
|
-
|
0.00
|
%
|
||||||||||||||||
|
Debt securities - taxable
|
554,324
|
6,672
|
2.42
|
%
|
279,293
|
3,863
|
2.79
|
%
|
||||||||||||||||
|
Debt securities - nontaxable
|
119,538
|
1,694
|
2.85
|
%
|
31,780
|
561
|
3.56
|
%
|
||||||||||||||||
|
Other interest-bearing assets
|
162,944
|
858
|
1.06
|
%
|
295,858
|
3,517
|
2.40
|
%
|
||||||||||||||||
|
Total interest-earning assets
|
3,108,186
|
70,179
|
4.54
|
%
|
2,558,124
|
64,717
|
5.10
|
%
|
||||||||||||||||
|
Noninterest-earning assets
|
250,114
|
175,689
|
||||||||||||||||||||||
|
Total assets
|
$
|
3,358,300
|
$
|
2,733,813
|
||||||||||||||||||||
|
Liabilities & stockholders’ equity
|
||||||||||||||||||||||||
|
NOW, Savings, MMA’s
|
$
|
1,598,048
|
3,986
|
0.50
|
%
|
$
|
1,459,684
|
9,230
|
1.28
|
%
|
||||||||||||||
|
Time deposits
|
340,016
|
3,057
|
1.81
|
%
|
313,505
|
2,798
|
1.80
|
%
|
||||||||||||||||
|
Short-term borrowings
|
23,597
|
99
|
0.84
|
%
|
16,904
|
168
|
2.00
|
%
|
||||||||||||||||
|
Notes payable & other long-term borrowings
|
128,654
|
453
|
0.71
|
%
|
95,000
|
1,100
|
2.33
|
%
|
||||||||||||||||
|
Subordinated debt securities
|
26,472
|
807
|
6.13
|
%
|
27,100
|
809
|
6.02
|
%
|
||||||||||||||||
|
Junior subordinated deferrable interest debentures
|
46,393
|
695
|
3.01
|
%
|
46,393
|
1,025
|
4.46
|
%
|
||||||||||||||||
|
Total interest-bearing liabilities
|
2,163,180
|
9,097
|
0.85
|
%
|
1,958,586
|
15,130
|
1.56
|
%
|
||||||||||||||||
|
Demand deposits
|
833,699
|
508,951
|
||||||||||||||||||||||
|
Other liabilities
|
37,364
|
31,021
|
||||||||||||||||||||||
|
Stockholders’ equity
|
324,057
|
235,255
|
||||||||||||||||||||||
|
Total liabilities & stockholders’ equity
|
$
|
3,358,300
|
$
|
2,733,813
|
||||||||||||||||||||
|
Net interest income
|
$
|
61,082
|
$
|
49,587
|
||||||||||||||||||||
|
Net interest margin (2)
|
3.95
|
%
|
3.91
|
%
|
||||||||||||||||||||
| (1) |
Average loan balances include nonaccrual loans and loans held for sale.
|
| (2) |
Net interest margin is calculated as the annualized net income, on a fully tax-equivalent basis, divided by average interest-earning assets.
|
South Plains Financial, Inc.
Consolidated Balance Sheets
(Unaudited)
(Dollars in thousands)
|
As of
|
||||||||
|
June 30,
2020
|
December 31,
2019
|
|||||||
|
Assets
|
||||||||
|
Cash and due from banks
|
$
|
51,256
|
$
|
56,246
|
||||
|
Interest-bearing deposits in banks
|
204,845
|
101,853
|
||||||
|
Investment securities
|
730,674
|
707,650
|
||||||
|
Loans held for sale
|
92,774
|
49,035
|
||||||
|
Loans held for investment
|
2,331,716
|
2,143,623
|
||||||
|
Less: Allowance for loan losses
|
(40,635
|
)
|
(24,197
|
)
|
||||
|
Net loans held for investment
|
2,291,081
|
2,119,426
|
||||||
|
Premises and equipment, net
|
61,883
|
61,873
|
||||||
|
Goodwill
|
19,968
|
18,757
|
||||||
|
Intangible assets
|
8,446
|
8,632
|
||||||
|
Other assets
|
123,605
|
113,695
|
||||||
|
Total assets
|
$
|
3,584,532
|
$
|
3,237,167
|
||||
|
Liabilities and Stockholders’ Equity Liabilities
|
||||||||
|
Noninterest bearing deposits
|
$
|
940,853
|
$
|
790,921
|
||||
|
Interest-bearing deposits
|
2,006,984
|
1,905,936
|
||||||
|
Total deposits
|
2,947,837
|
2,696,857
|
||||||
|
Other borrowings
|
179,565
|
132,165
|
||||||
|
Subordinated debt securities
|
26,472
|
26,472
|
||||||
|
Trust preferred subordinated debentures
|
46,393
|
46,393
|
||||||
|
Other liabilities
|
47,731
|
29,098
|
||||||
|
Total liabilities
|
3,247,998
|
2,930,985
|
||||||
|
Stockholders’ Equity
|
||||||||
|
Common stock
|
18,059
|
18,036
|
||||||
|
Additional paid-in capital
|
140,620
|
140,492
|
||||||
|
Retained earnings
|
158,311
|
146,696
|
||||||
|
Accumulated other comprehensive income (loss)
|
19,544
|
958
|
||||||
|
Total stockholders’ equity
|
336,534
|
306,182
|
||||||
|
Total liabilities and stockholders’ equity
|
$
|
3,584,532
|
$
|
3,237,167
|
||||
South Plains Financial, Inc.
Consolidated Statements of Income
(Unaudited)
(Dollars in thousands)
|
Three Months Ended
|
Six Months Ended
|
|||||||||||||||
|
June 30,
2020
|
June 30,
2019
|
June 30,
2020
|
June 30,
2019
|
|||||||||||||
|
Interest income:
|
||||||||||||||||
|
Loans, including fees
|
$
|
29,861
|
$
|
28,592
|
$
|
60,876
|
$
|
56,690
|
||||||||
|
Other
|
4,146
|
3,917
|
8,868
|
7,823
|
||||||||||||
|
Total Interest income
|
34,007
|
32,509
|
69,744
|
64,513
|
||||||||||||
|
Interest expense:
|
||||||||||||||||
|
Deposits
|
2,760
|
6,139
|
7,043
|
12,028
|
||||||||||||
|
Subordinated debt securities
|
403
|
403
|
807
|
809
|
||||||||||||
|
Trust preferred subordinated debentures
|
294
|
512
|
695
|
1,025
|
||||||||||||
|
Other
|
102
|
618
|
552
|
1,268
|
||||||||||||
|
Total Interest expense
|
3,559
|
7,672
|
9,097
|
15,130
|
||||||||||||
|
Net interest income
|
30,448
|
24,837
|
60,647
|
49,383
|
||||||||||||
|
Provision for loan losses
|
13,133
|
875
|
19,367
|
1,483
|
||||||||||||
|
Net interest income after provision for loan losses
|
17,315
|
23,962
|
41,280
|
47,900
|
||||||||||||
|
Noninterest income:
|
||||||||||||||||
|
Service charges on deposits
|
1,439
|
1,979
|
3,422
|
3,884
|
||||||||||||
|
Income from insurance activities
|
1,022
|
1,210
|
2,181
|
2,960
|
||||||||||||
|
Mortgage banking activities
|
17,955
|
6,652
|
26,708
|
11,518
|
||||||||||||
|
Bank card services and interchange fees
|
2,344
|
2,071
|
4,582
|
4,081
|
||||||||||||
|
Other
|
2,136
|
1,791
|
4,560
|
3,335
|
||||||||||||
|
Total Noninterest income
|
24,896
|
13,703
|
43,771
|
25,778
|
||||||||||||
|
Noninterest expense:
|
||||||||||||||||
|
Salaries and employee benefits
|
21,621
|
18,784
|
42,431
|
37,909
|
||||||||||||
|
Net occupancy expense
|
3,586
|
3,416
|
7,186
|
6,823
|
||||||||||||
|
Professional services
|
1,961
|
1,611
|
3,533
|
3,317
|
||||||||||||
|
Marketing and development
|
806
|
796
|
1,574
|
1,513
|
||||||||||||
|
Other
|
7,233
|
5,323
|
14,494
|
10,404
|
||||||||||||
|
Total noninterest expense
|
35,207
|
29,930
|
69,218
|
59,966
|
||||||||||||
|
Income before income taxes
|
7,004
|
7,735
|
15,833
|
13,712
|
||||||||||||
|
Income tax expense (benefit)
|
1,389
|
1,655
|
3,135
|
2,859
|
||||||||||||
|
Net income
|
$
|
5,615
|
$
|
6,080
|
$
|
12,698
|
$
|
10,853
|
||||||||
South Plains Financial, Inc.
Loan Composition
(Unaudited)
(Dollars in thousands)
|
As of
|
||||||||
|
June 30,
2020
|
December 31,
2019
|
|||||||
|
Loans:
|
||||||||
|
Commercial Real Estate
|
$
|
648,888
|
$
|
658,195
|
||||
|
Commercial - Specialized
|
325,942
|
309,505
|
||||||
|
Commercial - General
|
627,923
|
441,398
|
||||||
|
Consumer:
|
||||||||
|
1-4 Family Residential
|
360,308
|
362,796
|
||||||
|
Auto Loans
|
202,263
|
215,209
|
||||||
|
Other Consumer
|
69,754
|
74,000
|
||||||
|
Construction
|
96,638
|
82,520
|
||||||
|
Total loans held for investment
|
$
|
2,331,716
|
$
|
2,143,623
|
||||
South Plains Financial, Inc.
Deposit Composition
(Unaudited)
(Dollars in thousands)
|
As of
|
||||||||
|
June 30,
2020
|
December 31,
2019
|
|||||||
|
Deposits:
|
||||||||
|
Noninterest-bearing demand deposits
|
$
|
940,853
|
$
|
790,921
|
||||
|
NOW & other transaction accounts
|
344,485
|
318,379
|
||||||
|
MMDA & other savings
|
1,340,004
|
1,231,534
|
||||||
|
Time deposits
|
322,495
|
356,023
|
||||||
|
Total deposits
|
$
|
2,947,837
|
$
|
2,696,857
|
||||
South Plains Financial, Inc.
Reconciliation of Non-GAAP Financial Measures
(Unaudited)
(Dollars in thousands)
|
As of and for the quarter ended
|
||||||||||||||||||||
|
June 30,
2020
|
March 31,
2020
|
December 31,
2019
|
September 30,
2019
|
June 30,
2019
|
||||||||||||||||
|
Efficiency Ratio
|
||||||||||||||||||||
|
Noninterest expense
|
$
|
35,207
|
$
|
34,011
|
$
|
31,714
|
$
|
30,028
|
$
|
29,930
|
||||||||||
|
Net interest income
|
30,448
|
30,199
|
28,624
|
26,568
|
24,837
|
|||||||||||||||
|
Tax equivalent yield adjustment
|
290
|
145
|
133
|
103
|
101
|
|||||||||||||||
|
Noninterest income
|
24,896
|
18,875
|
16,740
|
14,115
|
13,703
|
|||||||||||||||
|
Total income
|
55,634
|
49,219
|
45,497
|
40,786
|
38,641
|
|||||||||||||||
|
Efficiency ratio
|
63.28
|
%
|
69.10
|
%
|
69.71
|
%
|
73.62
|
%
|
77.46
|
%
|
||||||||||
|
Noninterest expense
|
$
|
35,207
|
$
|
34,011
|
$
|
31,714
|
$
|
30,028
|
$
|
29,930
|
||||||||||
|
Less: net loss on sale of securities
|
-
|
-
|
(27
|
)
|
-
|
-
|
||||||||||||||
|
Adjusted noninterest expense
|
35,207
|
34,011
|
31,687
|
30,028
|
29,930
|
|||||||||||||||
|
Total income
|
55,634
|
49,219
|
45,497
|
40,786
|
38,641
|
|||||||||||||||
|
Less: net gain on sale of securities
|
-
|
(2,318
|
)
|
-
|
-
|
-
|
||||||||||||||
|
Adjusted total income
|
55,634
|
46,901
|
45,497
|
40,786
|
38,641
|
|||||||||||||||
|
Adjusted efficiency ratio
|
63.28
|
%
|
72.52
|
%
|
69.65
|
%
|
73.62
|
%
|
77.46
|
%
|
||||||||||
|
Pre-tax, pre-provision income
|
||||||||||||||||||||
|
Net income
|
$
|
5,615
|
7,083
|
10,109
|
8,258
|
6,080
|
||||||||||||||
|
Income tax expense
|
1,389
|
1,746
|
2,645
|
1,977
|
1,655
|
|||||||||||||||
|
Provision for loan losses
|
13,133
|
6,234
|
896
|
420
|
875
|
|||||||||||||||
|
Pre-tax, pre-provision income
|
$
|
20,137
|
15,063
|
13,650
|
10,655
|
8,610
|
||||||||||||||
South Plains Financial, Inc.
Reconciliation of Non-GAAP Financial Measures
(Unaudited)
(Dollars in thousands)
|
As of
|
||||||||
|
June 30,
2020
|
December 31,
2019
|
|||||||
|
Tangible common equity
|
||||||||
|
Total common stockholders’ equity
|
$
|
336,534
|
$
|
306,182
|
||||
|
Less: goodwill and other intangibles
|
(28,414
|
)
|
(27,389
|
)
|
||||
|
Tangible common equity
|
$
|
308,120
|
$
|
278,793
|
||||
|
Tangible assets
|
||||||||
|
Total assets
|
$
|
3,584,532
|
$
|
3,237,167
|
||||
|
Less: goodwill and other intangibles
|
(28,414
|
)
|
(27,389
|
)
|
||||
|
Tangible assets
|
$
|
3,556,118
|
$
|
3,209,778
|
||||
|
Shares outstanding
|
18,059,174
|
18,036,115
|
||||||
|
Total stockholders’ equity to total assets
|
9.39
|
%
|
9.46
|
%
|
||||
|
Tangible common equity to tangible assets
|
8.66
|
%
|
8.69
|
%
|
||||
|
Book value per share
|
$
|
18.64
|
$
|
16.98
|
||||
|
Tangible book value per share
|
$
|
17.06
|
$
|
15.46
|
||||
Exhibit 99.2
South Plains Financial Earnings Presentation Second Quarter, 2020 *
Forward-Looking Statements and Disclosures FORWARD-LOOKING STATEMENTSThis presentation contains, and
future oral and written statements of South Plains Financial, Inc. (“South Plains” or the “Company”) and City Bank may contain, statements about future events that constitute forward-looking statements within the meaning of the Private
Securities Litigation Reform Act of 1995. These forward-looking statements reflect South Plains’ current views with respect to, among other things, future events and South Plains’ financial performance. Any statements about South Plains’
expectations, beliefs, plans, predictions, forecasts, objectives, assumptions or future events or performance are not historical facts and may be forward-looking. These statements are often, but not always, made through the use of words or
phrases such as “anticipate,” “believes,” “can,” “could,” “may,” “predicts,” “potential,” “should,” “will,” “estimate,” “plans,” “projects,” “continuing,” “ongoing,” “expects,” “intends” and similar words or phrases. Forward-looking
statements include, but are not limited to: (i) projections and estimates of revenues, expenses, income or loss, earnings or loss per share, and other financial items, including our estimated financial results for 2020, (ii) statements of
plans, objectives and expectations of South Plains or its management, (iii) statements of future economic performance, and (iv) statements of assumptions underlying such statements. Forward-looking statements should not be relied on because
they involve known and unknown risks, uncertainties and other factors, some of which are beyond the control of South Plains and City Bank. These risks, uncertainties and other factors may cause the actual results, performance, and
achievements of South Plains and City Bank to be materially different from the anticipated future results, performance or achievements expressed in, or implied by, the forward-looking statements. Factors that could cause such differences
include, but are not limited to, local, regional, national and international economic conditions, the extent of the impact of the COVID-19 pandemic, including the impact of actions taken by governmental and regulatory authorities in response
to such pandemic, such as the Coronavirus Aid, Relief, and Economic Security Act and subsequent related legislations, and the programs established thereunder, and City Bank’s participation in such programs, volatility of the financial
markets, changes in interest rates, regulatory considerations, competition and market expansion opportunities, changes in non-interest expenditures or in the anticipated benefits of such expenditures, the receipt of required regulatory
approvals, changes in non-performing assets and charge-offs, changes in tax laws, current or future litigation, regulatory examinations or other legal and/or regulatory actions, the impact of any tariffs, terrorist threats and attacks, acts
of war or threats thereof or other pandemics. Therefore, South Plains can give no assurance that the results contemplated in the forward-looking statements will be realized. For more information about these factors, please see South Plains’
reports filed with or furnished to the SEC, including South Plains’ most recent Annual Report on Form 10-K and Quarterly Report on Form 10-Q on file with the U.S. Securities and Exchange Commission (the “SEC”), including the sections entitled
"Risk Factors" and "Management's Discussion and Analysis of Financial Condition and Results of Operations." Further, any forward-looking statement speaks only as of the date on which it is made and South Plains undertakes no obligation to
update or revise any forward-looking statement to reflect events or circumstances after the date on which the statement is made or to reflect the occurrence of unanticipated events, except as required by law. All forward-looking statements
herein are qualified by these cautionary statement.NON-GAAP FINANCIAL MEASURESManagement believes that certain non-GAAP performance measures used in this presentation provide meaningful information about underlying trends in its business and
operations. Non-GAAP financial measures should be viewed in addition to, and not as an alternative for, SPFI’s reported results prepared in accordance with GAAP. Numbers in this presentation may not sum due to rounding. *
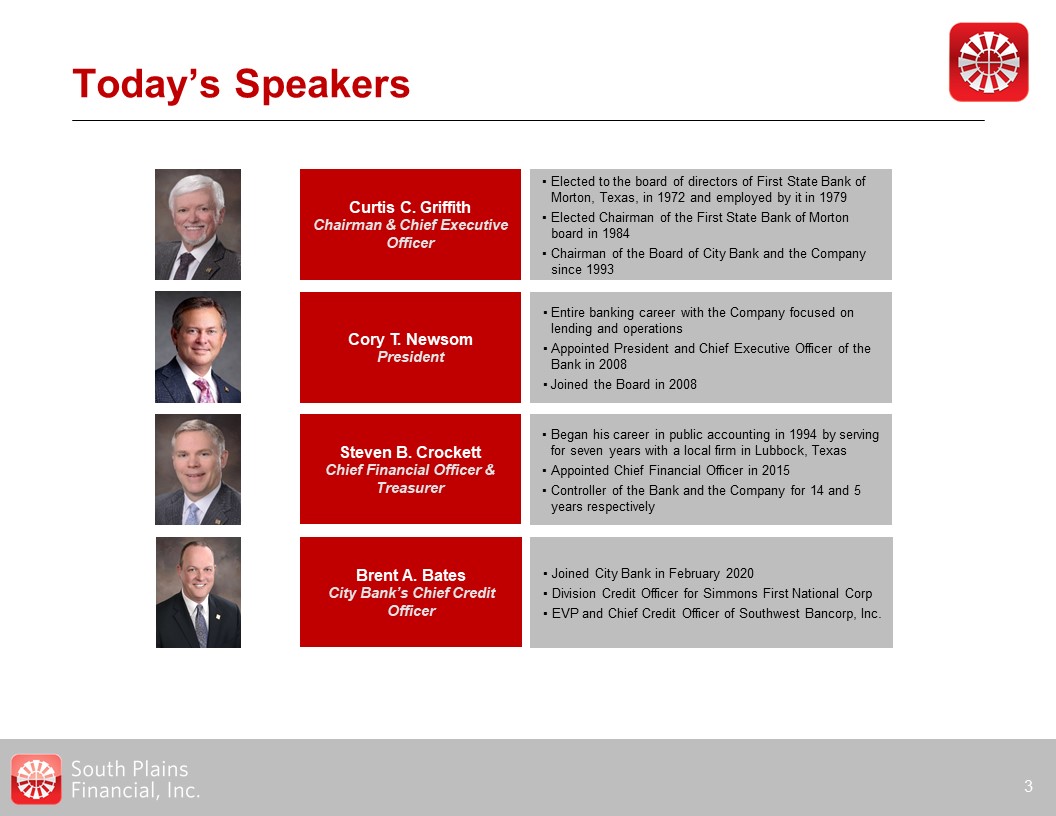
Today’s Speakers * Curtis C. Griffith Chairman & Chief Executive Officer Elected to the board
of directors of First State Bank of Morton, Texas, in 1972 and employed by it in 1979Elected Chairman of the First State Bank of Morton board in 1984Chairman of the Board of City Bank and the Company since 1993 Steven B. Crockett Chief
Financial Officer & Treasurer Began his career in public accounting in 1994 by serving for seven years with a local firm in Lubbock, TexasAppointed Chief Financial Officer in 2015Controller of the Bank and the Company for 14 and 5 years
respectively Cory T. Newsom President Entire banking career with the Company focused on lending and operationsAppointed President and Chief Executive Officer of the Bank in 2008Joined the Board in 2008 Brent A. Bates City Bank’s Chief
Credit Officer Joined City Bank in February 2020Division Credit Officer for Simmons First National CorpEVP and Chief Credit Officer of Southwest Bancorp, Inc.
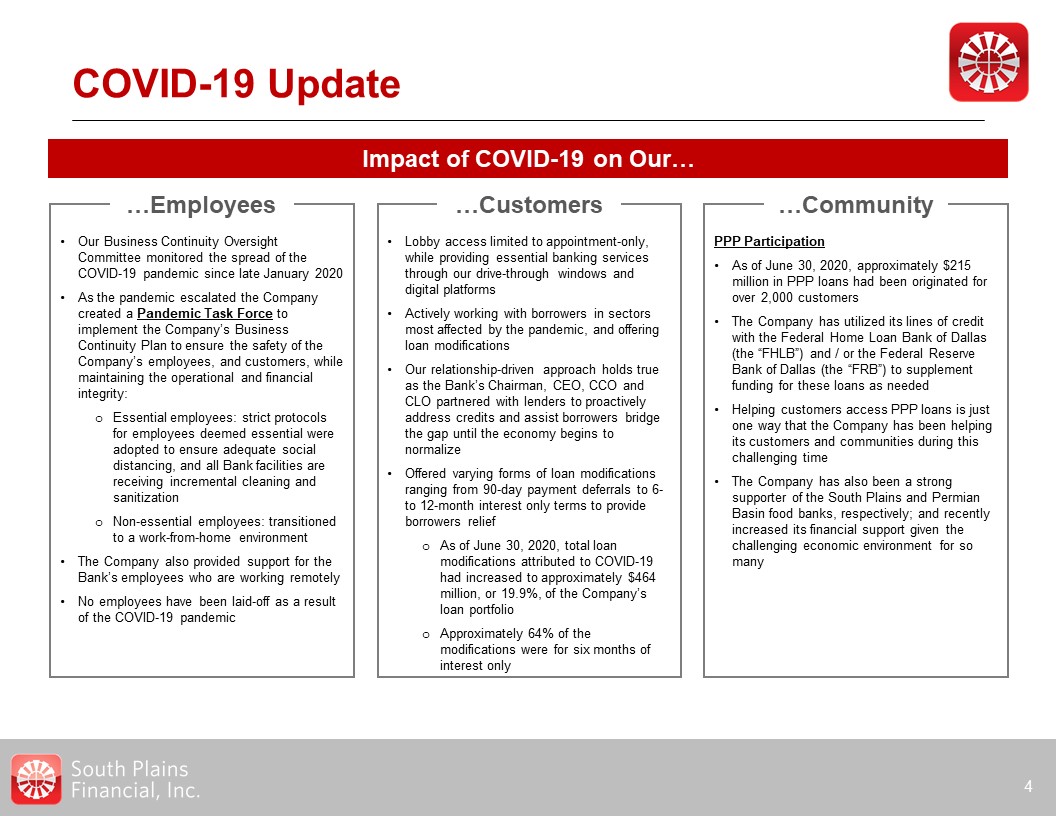
COVID-19 Update * Impact of COVID-19 on Our… Our Business Continuity Oversight Committee monitored
the spread of the COVID-19 pandemic since late January 2020As the pandemic escalated the Company created a Pandemic Task Force to implement the Company’s Business Continuity Plan to ensure the safety of the Company’s employees, and customers,
while maintaining the operational and financial integrity:Essential employees: strict protocols for employees deemed essential were adopted to ensure adequate social distancing, and all Bank facilities are receiving incremental cleaning and
sanitizationNon-essential employees: transitioned to a work-from-home environmentThe Company also provided support for the Bank’s employees who are working remotelyNo employees have been laid-off as a result of the COVID-19 pandemic Lobby
access limited to appointment-only, while providing essential banking services through our drive-through windows and digital platformsActively working with borrowers in sectors most affected by the pandemic, and offering loan modificationsOur
relationship-driven approach holds true as the Bank’s Chairman, CEO, CCO and CLO partnered with lenders to proactively address credits and assist borrowers bridge the gap until the economy begins to normalizeOffered varying forms of loan
modifications ranging from 90-day payment deferrals to 6- to 12-month interest only terms to provide borrowers reliefAs of June 30, 2020, total loan modifications attributed to COVID-19 had increased to approximately $464 million, or 19.9%,
of the Company’s loan portfolioApproximately 64% of the modifications were for six months of interest only PPP ParticipationAs of June 30, 2020, approximately $215 million in PPP loans had been originated for over 2,000 customersThe Company
has utilized its lines of credit with the Federal Home Loan Bank of Dallas (the “FHLB”) and / or the Federal Reserve Bank of Dallas (the “FRB”) to supplement funding for these loans as neededHelping customers access PPP loans is just one way
that the Company has been helping its customers and communities during this challenging timeThe Company has also been a strong supporter of the South Plains and Permian Basin food banks, respectively; and recently increased its financial
support given the challenging economic environment for so many …Employees …Customers …Community
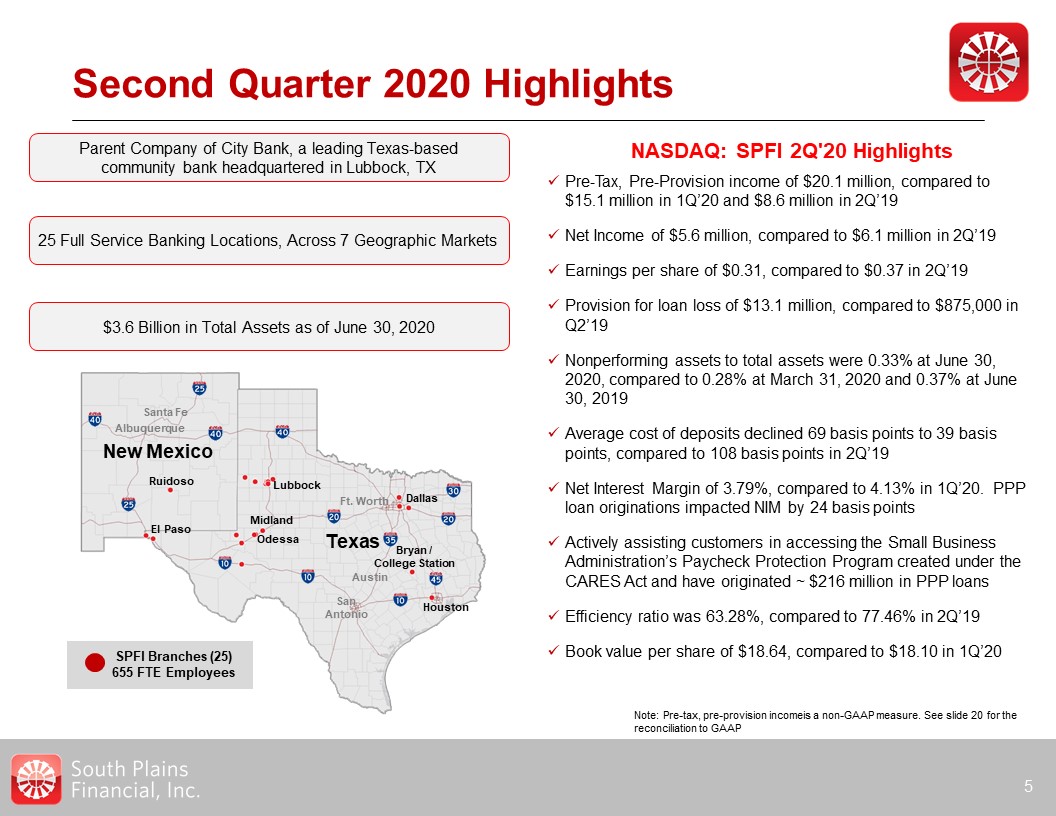
$3.6 Billion in Total Assets as of June 30, 2020 Parent Company of City Bank, a leading Texas-based
community bank headquartered in Lubbock, TX Second Quarter 2020 Highlights * Pre-Tax, Pre-Provision income of $20.1 million, compared to $15.1 million in 1Q’20 and $8.6 million in 2Q’19Net Income of $5.6 million, compared to $6.1 million
in 2Q’19Earnings per share of $0.31, compared to $0.37 in 2Q’19Provision for loan loss of $13.1 million, compared to $875,000 in Q2’19Nonperforming assets to total assets were 0.33% at June 30, 2020, compared to 0.28% at March 31, 2020 and
0.37% at June 30, 2019Average cost of deposits declined 69 basis points to 39 basis points, compared to 108 basis points in 2Q’19Net Interest Margin of 3.79%, compared to 4.13% in 1Q’20. PPP loan originations impacted NIM by 24 basis
pointsActively assisting customers in accessing the Small Business Administration’s Paycheck Protection Program created under the CARES Act and have originated ~ $216 million in PPP loansEfficiency ratio was 63.28%, compared to 77.46% in
2Q’19Book value per share of $18.64, compared to $18.10 in 1Q’20 NASDAQ: SPFI 2Q'20 Highlights 25 Full Service Banking Locations, Across 7 Geographic Markets New Mexico Texas Dallas Bryan /College Station Houston Midland Odessa El
Paso Lubbock Ruidoso SanAntonio Ft. Worth Austin Albuquerque Santa Fe SPFI Branches (25)655 FTE Employees Note: Pre-tax, pre-provision incomeis a non-GAAP measure. See slide 20 for the reconciliation to GAAP
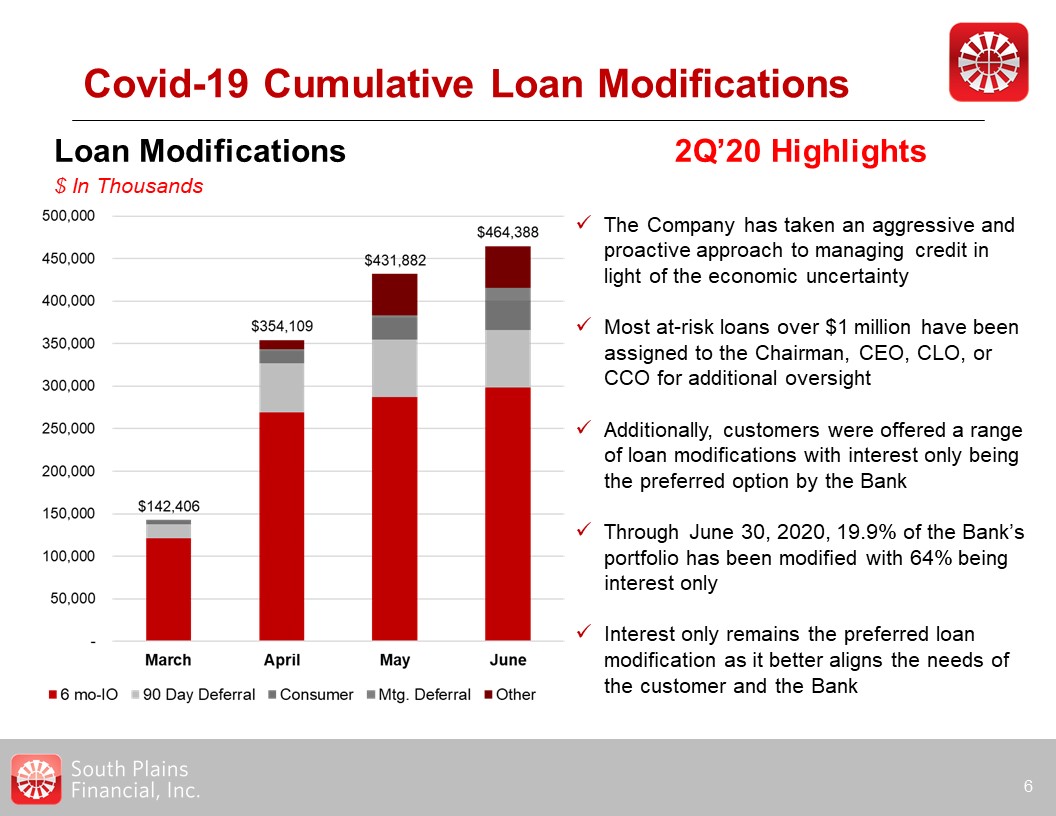
Covid-19 Cumulative Loan Modifications * The Company has taken an aggressive and proactive
approach to managing credit in light of the economic uncertaintyMost at-risk loans over $1 million have been assigned to the Chairman, CEO, CLO, or CCO for additional oversightAdditionally, customers were offered a range of loan modifications
with interest only being the preferred option by the BankThrough June 30, 2020, 19.9% of the Bank’s portfolio has been modified with 64% being interest onlyInterest only remains the preferred loan modification as it better aligns the needs of
the customer and the Bank 2Q’20 Highlights Loan Modifications$ In Thousands
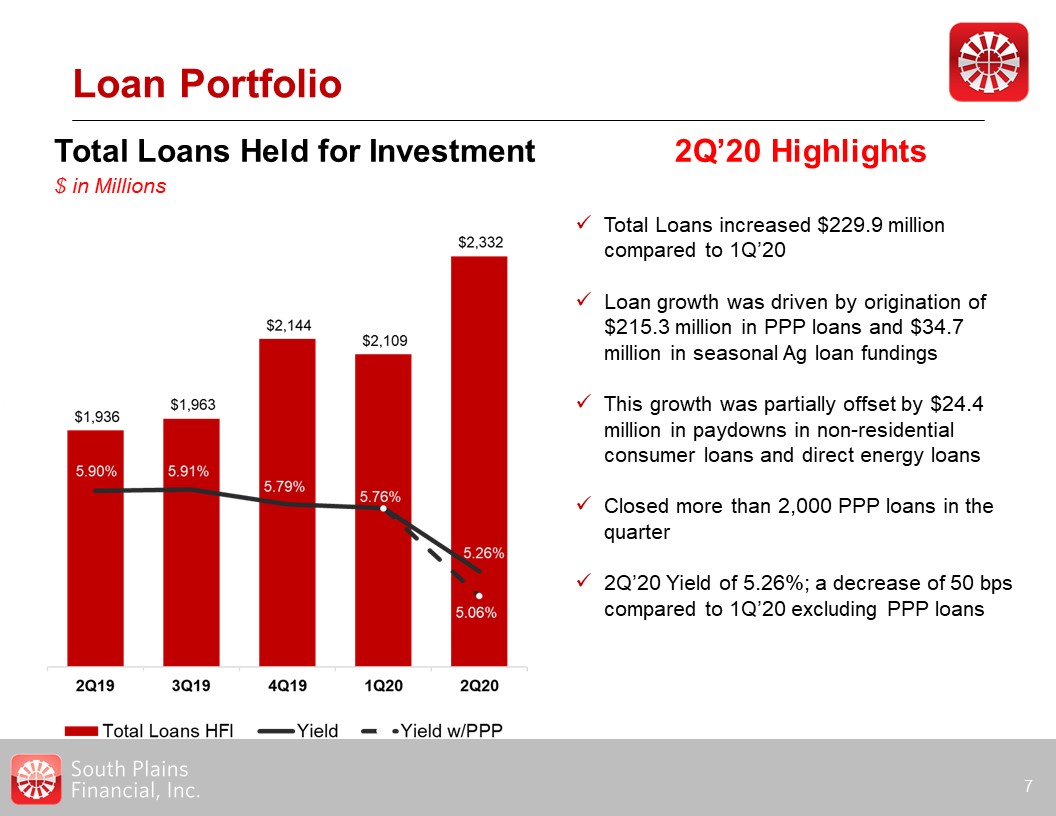
Loan Portfolio * Total Loans increased $229.9 million compared to 1Q’20Loan growth was driven by
origination of $215.3 million in PPP loans and $34.7 million in seasonal Ag loan fundings This growth was partially offset by $24.4 million in paydowns in non-residential consumer loans and direct energy loansClosed more than 2,000 PPP loans
in the quarter2Q’20 Yield of 5.26%; a decrease of 50 bps compared to 1Q’20 excluding PPP loans 2Q’20 Highlights Total Loans Held for Investment$ in Millions

Loan Portfolio * Commercial Real Estate includes:Comm. LDC & Res. LD – 9%Hospitality –
5%Commercial – General includes:PPP – 9%Owner – Occ. Rest. & Retail – 4%Commercial – Specialized includes:Agricultural production – 6%Direct energy – 3% 2Q’20 Highlights Portfolio Composition Net Loans2Q’20: $2.3 Billion
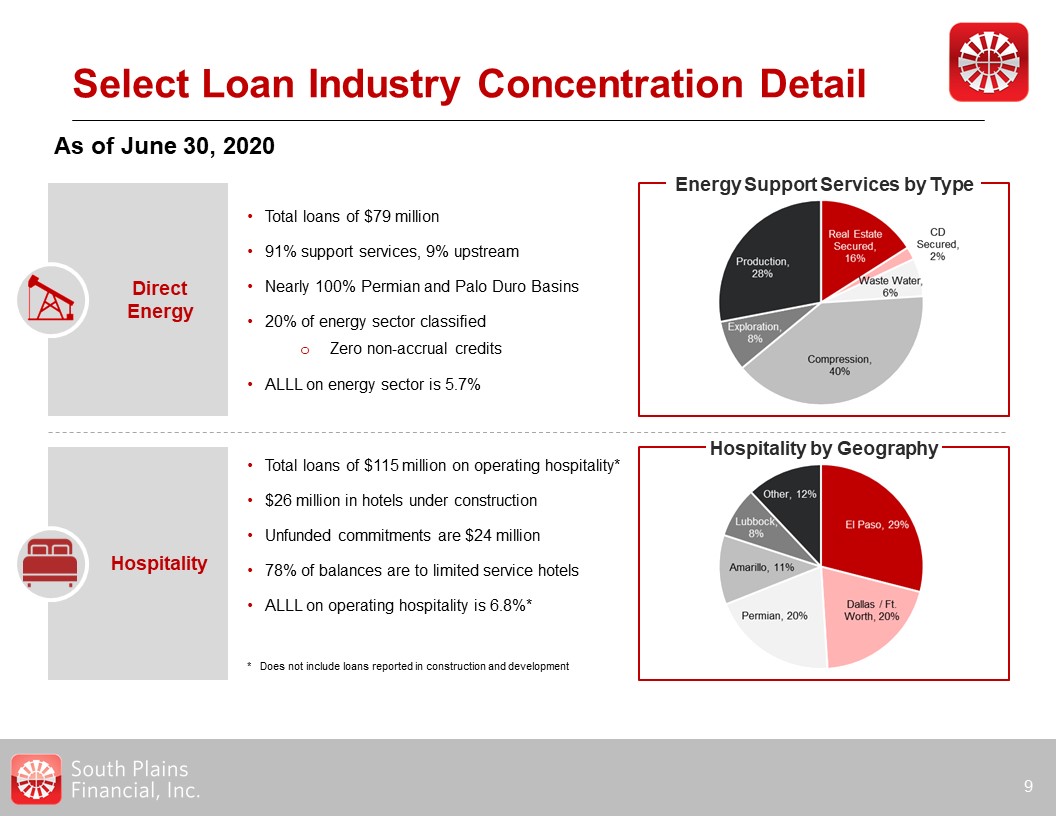
Hospitality Select Loan Industry Concentration Detail * As of June 30, 2020 DirectEnergy Total
loans of $79 million91% support services, 9% upstreamNearly 100% Permian and Palo Duro Basins20% of energy sector classifiedZero non-accrual creditsALLL on energy sector is 5.7% Total loans of $115 million on operating hospitality*$26
million in hotels under constructionUnfunded commitments are $24 million78% of balances are to limited service hotelsALLL on operating hospitality is 6.8%** Does not include loans reported in construction and development Energy Support
Services by Type Hospitality by Geography
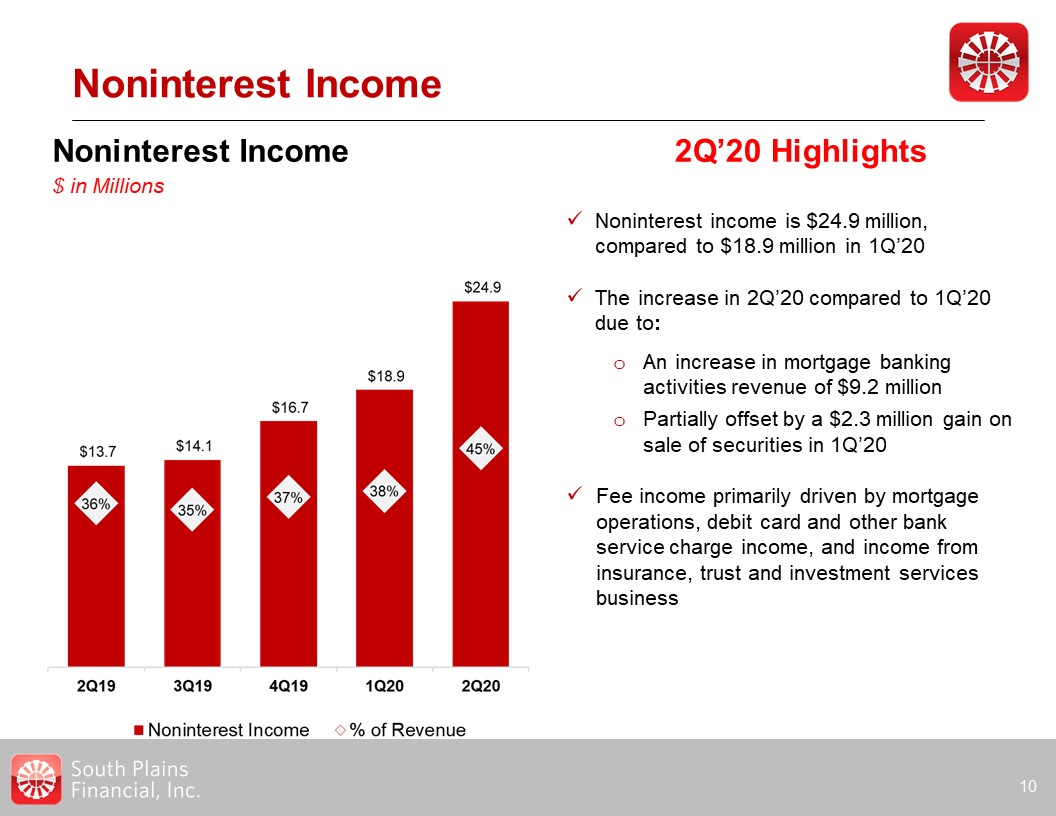
Noninterest Income * Noninterest Income$ in Millions 2Q’20 Highlights Noninterest income is $24.9
million, compared to $18.9 million in 1Q’20The increase in 2Q’20 compared to 1Q’20 due to:An increase in mortgage banking activities revenue of $9.2 millionPartially offset by a $2.3 million gain on sale of securities in 1Q’20Fee income
primarily driven by mortgage operations, debit card and other bank service charge income, and income from insurance, trust and investment services business

Diversified Revenue Stream Six Months Ended June 30, 2020 * Total Revenues$104.4
million Noninterest Income$43.8 million
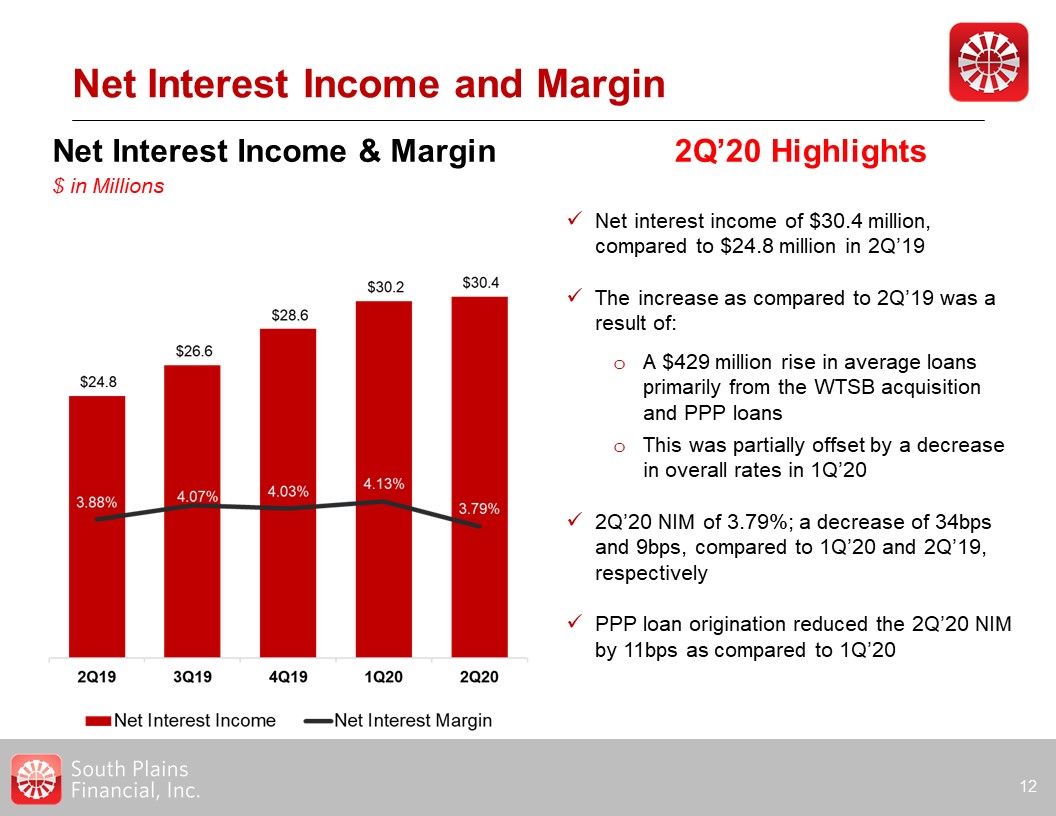
Net Interest Income and Margin * Net Interest Income & Margin$ in Millions 2Q’20
Highlights Net interest income of $30.4 million, compared to $24.8 million in 2Q’19The increase as compared to 2Q’19 was a result of:A $429 million rise in average loans primarily from the WTSB acquisition and PPP loans This was partially
offset by a decrease in overall rates in 1Q’202Q’20 NIM of 3.79%; a decrease of 34bps and 9bps, compared to 1Q’20 and 2Q’19, respectivelyPPP loan origination reduced the 2Q’20 NIM by 11bps as compared to 1Q’20
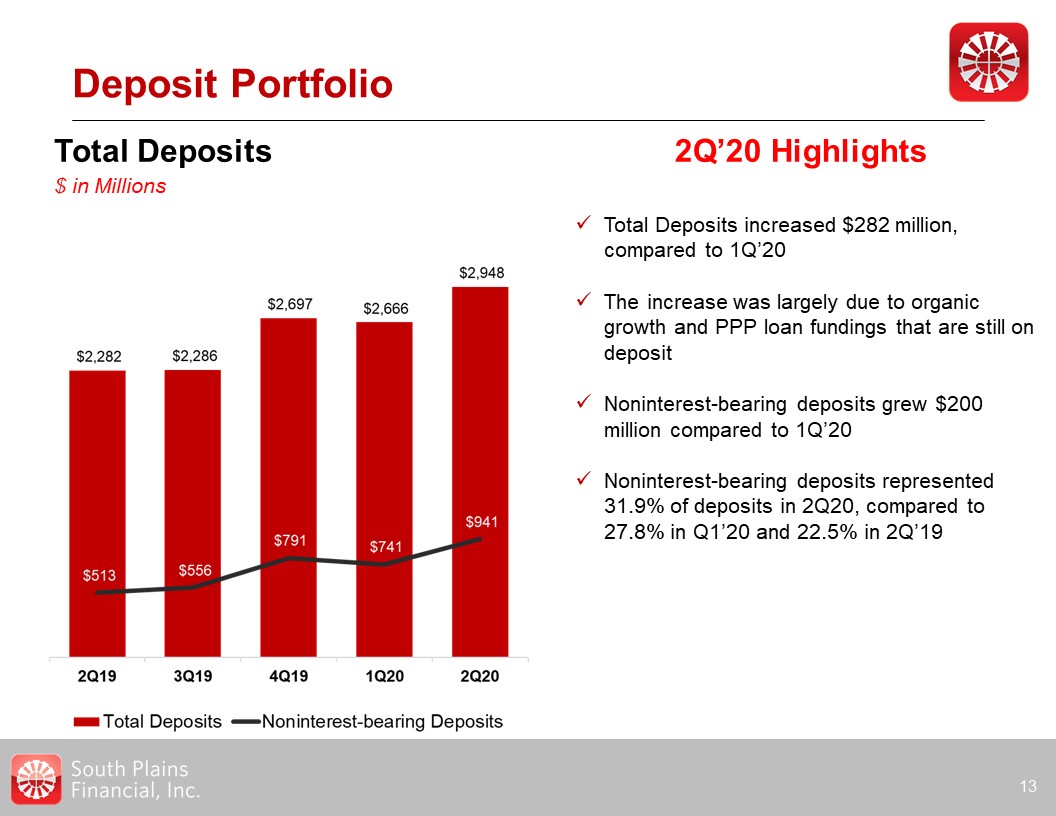
Deposit Portfolio * Total Deposits$ in Millions 2Q’20 Highlights Total Deposits increased $282
million, compared to 1Q’20The increase was largely due to organic growth and PPP loan fundings that are still on depositNoninterest-bearing deposits grew $200 million compared to 1Q’20 Noninterest-bearing deposits represented 31.9% of
deposits in 2Q20, compared to 27.8% in Q1’20 and 22.5% in 2Q’19
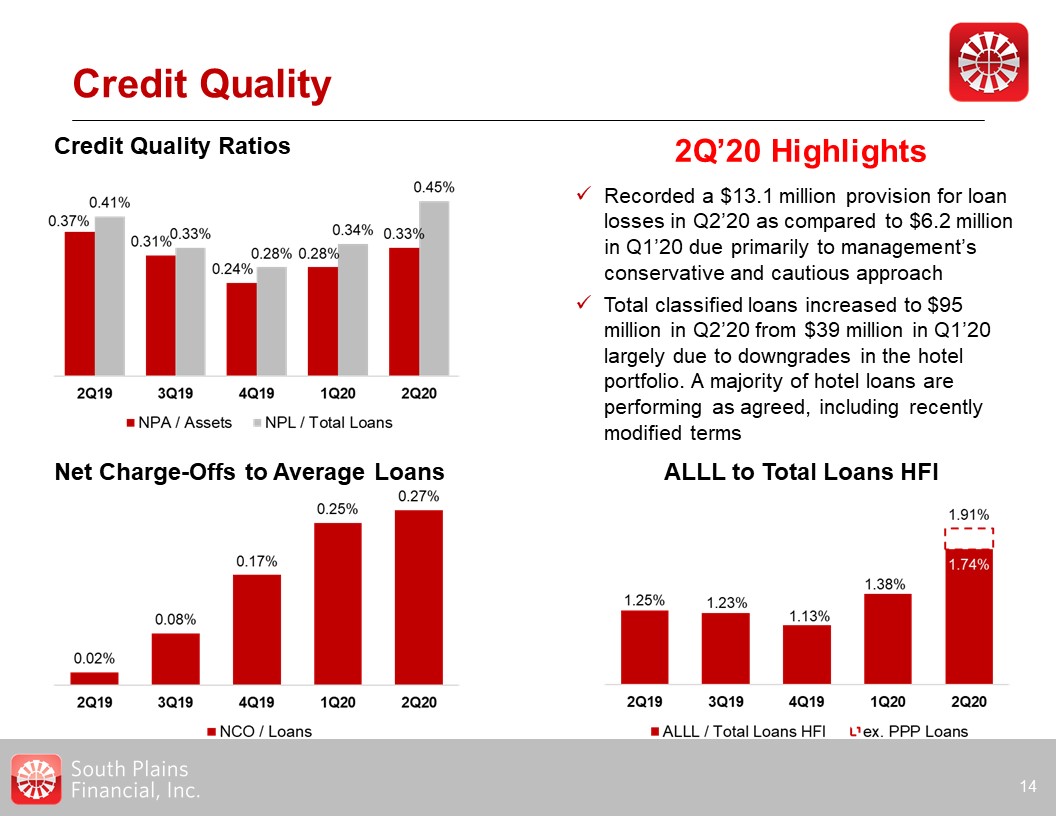
Credit Quality * 2Q’20 Highlights Credit Quality Ratios Recorded a $13.1 million provision for
loan losses in Q2’20 as compared to $6.2 million in Q1’20 due primarily to management’s conservative and cautious approach Total classified loans increased to $95 million in Q2’20 from $39 million in Q1’20 largely due to downgrades in the
hotel portfolio. A majority of hotel loans are performing as agreed, including recently modified terms Net Charge-Offs to Average Loans ALLL to Total Loans HFI
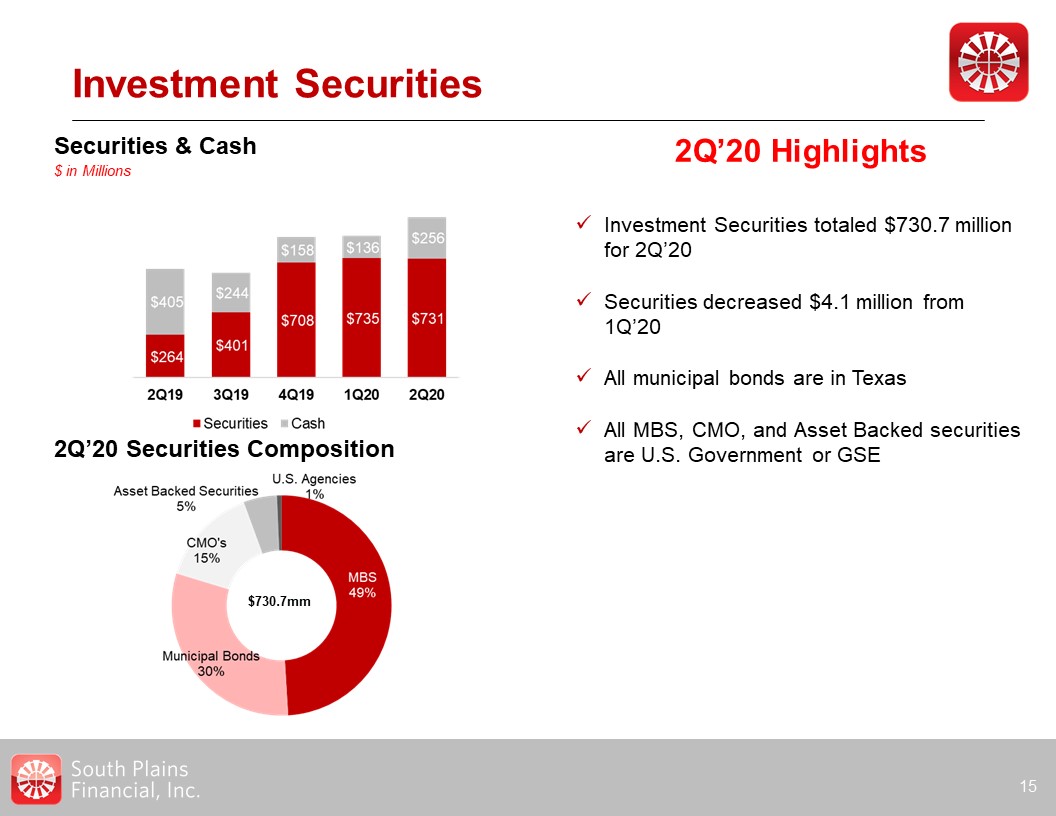
Investment Securities * 2Q’20 Highlights Investment Securities totaled $730.7 million for
2Q’20Securities decreased $4.1 million from 1Q’20All municipal bonds are in TexasAll MBS, CMO, and Asset Backed securities are U.S. Government or GSE 2Q’20 Securities Composition $730.7mm Securities & Cash$ in Millions
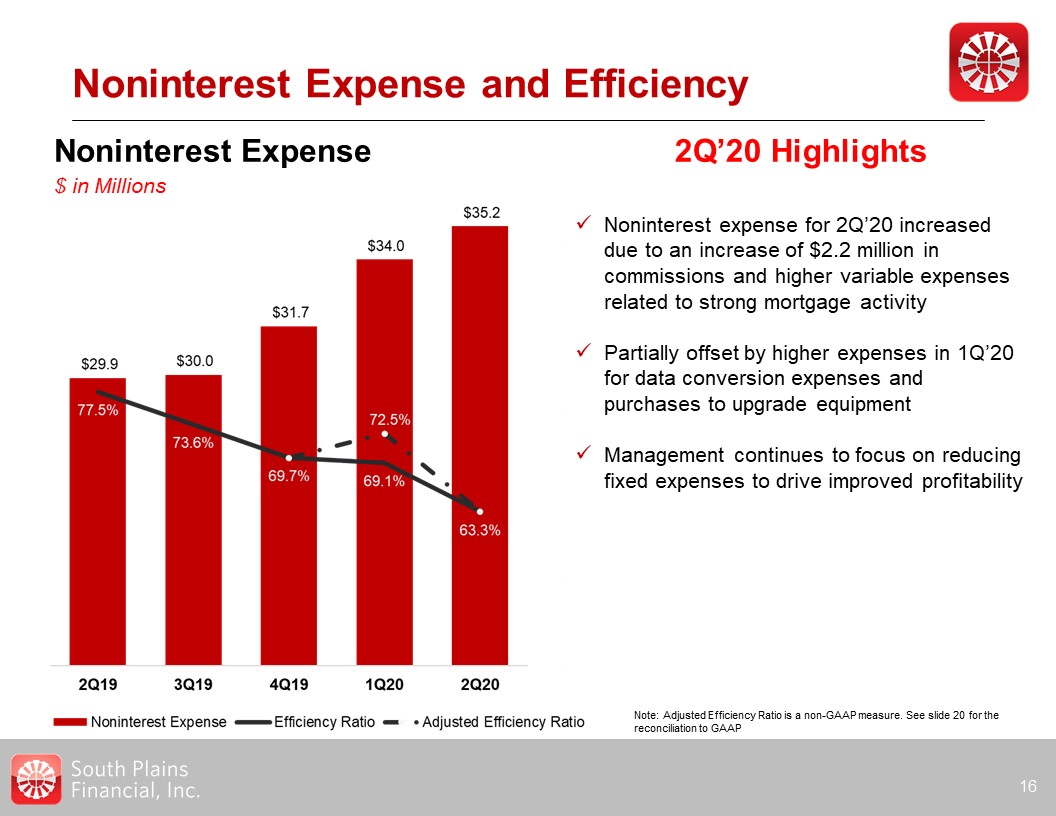
Noninterest Expense and Efficiency * Noninterest Expense$ in Millions 2Q’20 Highlights Noninterest
expense for 2Q’20 increased due to an increase of $2.2 million in commissions and higher variable expenses related to strong mortgage activityPartially offset by higher expenses in 1Q’20 for data conversion expenses and purchases to upgrade
equipment Management continues to focus on reducing fixed expenses to drive improved profitability Note: Adjusted Efficiency Ratio is a non-GAAP measure. See slide 20 for the reconciliation to GAAP
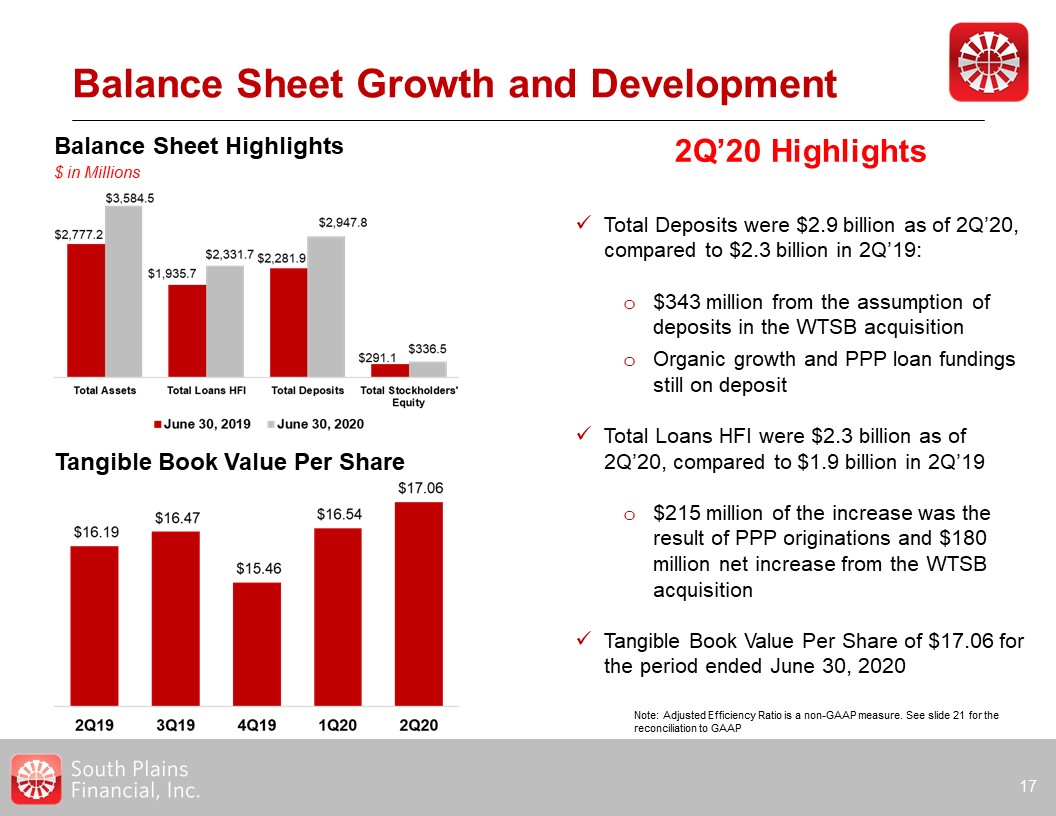
Balance Sheet Growth and Development * 2Q’20 Highlights Balance Sheet Highlights$ in
Millions Total Deposits were $2.9 billion as of 2Q’20, compared to $2.3 billion in 2Q’19:$343 million from the assumption of deposits in the WTSB acquisitionOrganic growth and PPP loan fundings still on depositTotal Loans HFI were $2.3
billion as of 2Q’20, compared to $1.9 billion in 2Q’19$215 million of the increase was the result of PPP originations and $180 million net increase from the WTSB acquisitionTangible Book Value Per Share of $17.06 for the period ended June 30,
2020 Tangible Book Value Per Share Note: Adjusted Efficiency Ratio is a non-GAAP measure. See slide 21 for the reconciliation to GAAP

Strong Capital Base * Total Stockholders’ Equity to Total Assets Ratio Common Equity Tier 1
Ratio Tier 1 Capital to Average Assets Ratio Total Capital to Risk-Weighted Assets Ratio

Appendix *
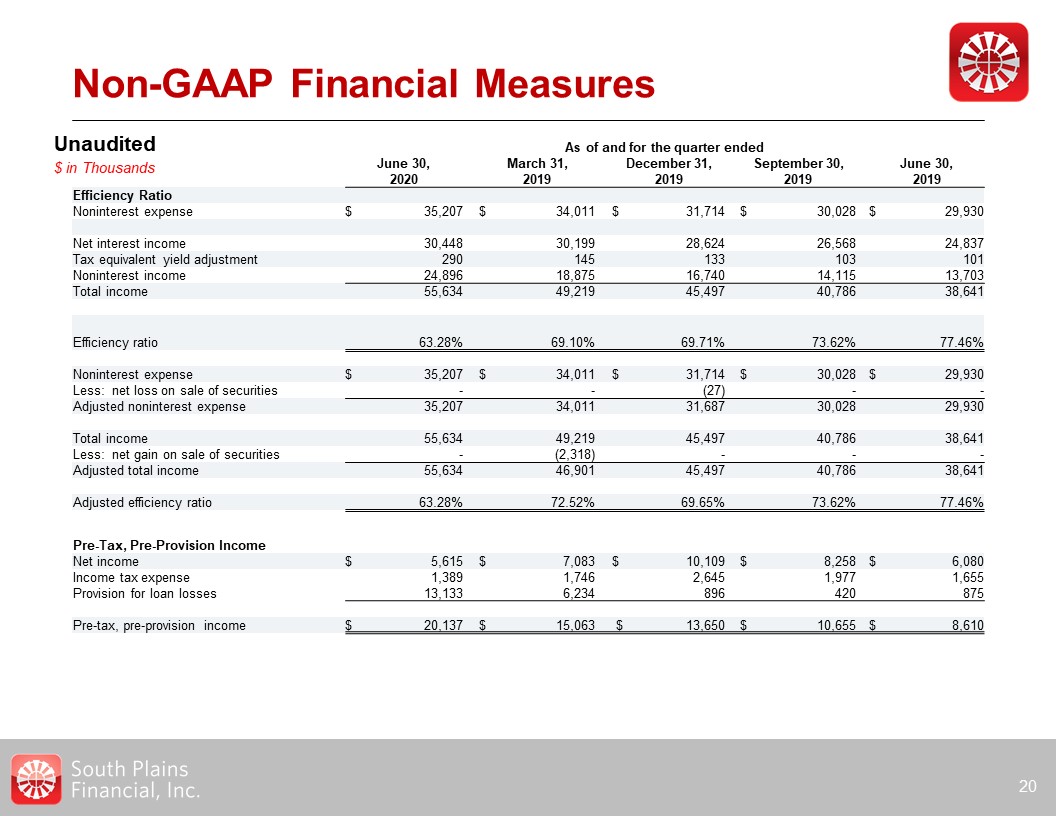
Non-GAAP Financial Measures * As of and for the quarter ended June
30,2020 March 31,2019 December 31,2019 September 30,2019 June 30,2019 Efficiency Ratio Noninterest expense $ 35,207 $ 34,011 $ 31,714 $ 30,028
$ 29,930 Net interest income 30,448 30,199 28,624 26,568 24,837 Tax equivalent yield adjustment 290 145 133 103 101 Noninterest
income 24,896 18,875 16,740 14,115 13,703 Total income 55,634 49,219 45,497 40,786 38,641 Efficiency ratio 63.28%
69.10% 69.71% 73.62% 77.46% Noninterest expense $ 35,207 $ 34,011 $ 31,714 $ 30,028 $ 29,930 Less: net loss on sale of securities - -
(27) - - Adjusted noninterest expense 35,207 34,011 31,687 30,028 29,930 Total income 55,634 49,219 45,497 40,786
38,641 Less: net gain on sale of securities - (2,318) - - - Adjusted total income 55,634 46,901 45,497 40,786 38,641 Adjusted
efficiency ratio 63.28% 72.52% 69.65% 73.62% 77.46% Unaudited$ in Thousands Pre-Tax, Pre-Provision Income Net income $ 5,615 $ 7,083 $ 10,109
$ 8,258 $ 6,080 Income tax expense 1,389 1,746 2,645 1,977 1,655 Provision for loan losses 13,133 6,234 896 420 875
Pre-tax, pre-provision income $ 20,137 $ 15,063 $ 13,650 $ 10,655 $ 8,610
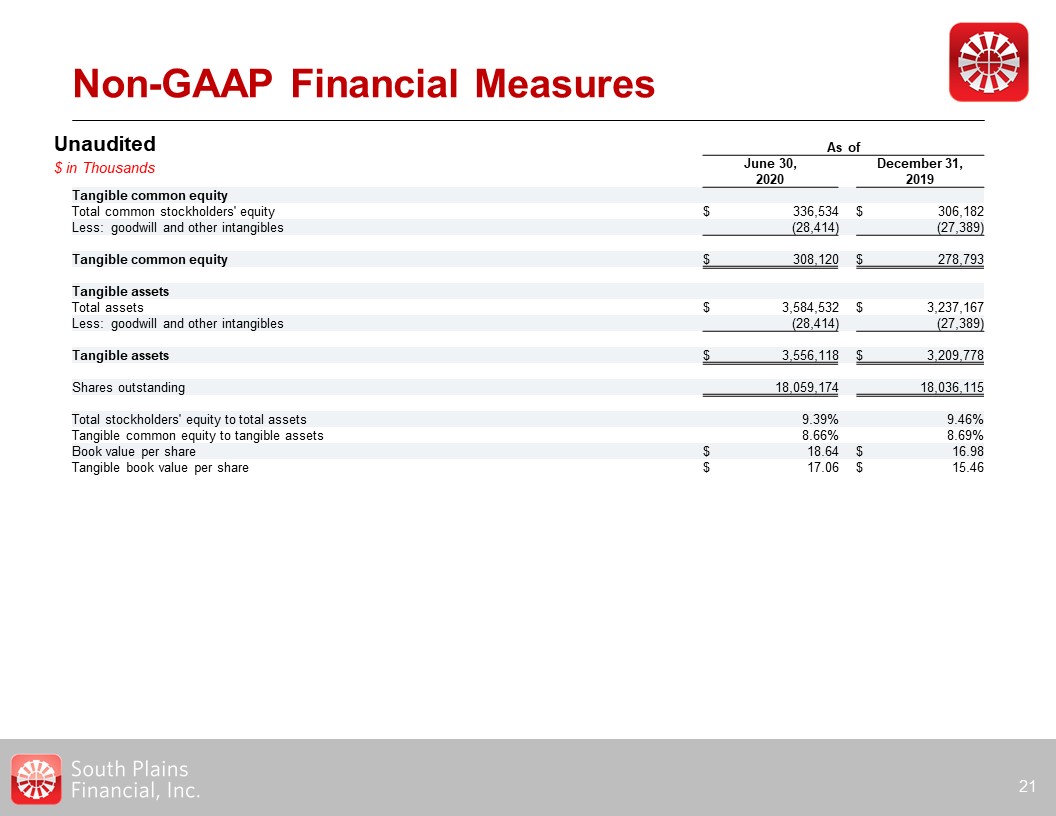
Non-GAAP Financial Measures * As of June 30,2020 December 31,2019 Tangible
common equity Total common stockholders' equity $ 336,534 $ 306,182 Less: goodwill and other intangibles (28,414) (27,389) Tangible common equity $ 308,120 $ 278,793
Tangible assets Total assets $ 3,584,532 $ 3,237,167 Less: goodwill and other intangibles (28,414) (27,389) Tangible assets $ 3,556,118 $ 3,209,778 Shares
outstanding 18,059,174 18,036,115 Total stockholders' equity to total assets 9.39% 9.46% Tangible common equity to tangible assets 8.66% 8.69% Book value per share $ 18.64
$ 16.98 Tangible book value per share $ 17.06 $ 15.46 Unaudited$ in Thousands