UNITED STATES
SECURITIES AND EXCHANGE COMMISSION
Washington, D.C. 20549
FORM 8-K
CURRENT REPORT
Pursuant to Section 13 or 15(d) of
the Securities Exchange Act of 1934
Date of Report (Date of earliest event reported): July 30, 2020
South Plains Financial, Inc.
(Exact name of registrant as specified in its charter)
|
Texas
|
001-38895
|
75-2453320
|
|
(State or other jurisdiction of incorporation)
|
(Commission File Number)
|
(IRS Employer Identification No.)
|
|
5219 City Bank Parkway Lubbock, Texas
|
79407
|
|
|
(Address of principal executive offices)
|
(Zip Code)
|
(806) 792-7101
(Registrant’s telephone number, including area code)
Check the appropriate box below if the Form 8-K filing is intended to simultaneously satisfy the filing obligation of the registrant under any of the following provisions:
| ☐ |
Written communications pursuant to Rule 425 under the Securities Act (17 CFR 230.425)
|
| ☐ |
Soliciting material pursuant to Rule 14a-12 under the Exchange Act (17 CFR 240.14a-12)
|
| ☐ |
Pre-commencement communications pursuant to Rule 14d-2(b) under the Exchange Act (17 CFR 240.14d-2(b))
|
| ☐ |
Pre-commencement communications pursuant to Rule 13e-4(c) under the Exchange Act (17 CFR 240.13e-4(c))
|
Securities registered pursuant to Section 12(b) of the Act:
|
Title of each class
|
Trading Symbol(s)
|
Name of each exchange on which registered
|
|
Common Stock, par value $1.00 per share
|
SPFI
|
The Nasdaq Stock Market LLC
|
Indicate by check mark whether the registrant is an emerging growth company as defined in Rule 405 of the Securities Act of 1933 (§230.405 of this chapter) or Rule 12b-2 of the Securities Exchange Act of 1934 (§240.12b-2 of this chapter).
Emerging growth company ☒
If an emerging growth company, indicate by check mark if the registrant has elected not to use the extended transition period for complying with any new or revised financial accounting standards provided pursuant to
Section 13(a) of the Exchange Act.☐
| Item 7.01 |
Regulation FD Disclosure.
|
On July 30, 2020, South Plains Financial, Inc. (the “Company”) will present at the Virtual Community Bank Investor Conference hosted by Keefe, Bruyette & Woods, Inc., a Stifel company. A
copy of the investor presentation that the Company will use at the conference is furnished as Exhibit 99.1 to this Current Report on Form 8-K and is incorporated herein by reference. This investor presentation will also be available on our
website, www.spfi.bank, under the “News & Events” section.
In accordance with General Instruction B.2 of Form 8-K, the information in Item 7.01 of this Current Report on Form 8-K, including Exhibit 99.1 hereto, shall not be deemed “filed” for the
purposes of Section 18 of the Securities Exchange Act of 1934, as amended, or otherwise subject to the liabilities of that section. The information in Item 7.01 of this Current Report on Form 8-K, including Exhibit 99.1 hereto, shall not be
incorporated by reference into any filing or other document pursuant to the Securities Act of 1933, as amended, except as shall be expressly set forth by specific reference in such filing or document.
| Item 9.01 |
Financial Statements and Exhibits.
|
|
(d)
|
Exhibits.
|
|
|
South Plains Financial Inc. Investor Presentation, dated July 30, 2020
|
SIGNATURES
Pursuant to the requirements of the Securities Exchange Act of 1934, the registrant has duly caused this report to be signed on its behalf by the undersigned hereunto duly authorized.
|
SOUTH PLAINS FINANCIAL, INC.
|
||
|
Dated: July 30, 2020
|
By:
|
/s/ Curtis C. Griffith
|
|
Curtis C. Griffith
|
||
|
Chairman and Chief Executive Officer
|
||
Exhibit 99.1
South Plains Financial Investor Presentation Second Quarter, 2020 1
Forward-Looking Statements and Disclosures FORWARD-LOOKING STATEMENTSThis presentation contains, and
future oral and written statements of South Plains Financial, Inc. (“South Plains” or the “Company”) and City Bank may contain, statements about future events that constitute forward-looking statements within the meaning of the Private
Securities Litigation Reform Act of 1995. These forward-looking statements reflect South Plains’ current views with respect to, among other things, future events and South Plains’ financial performance. Any statements about South Plains’
expectations, beliefs, plans, predictions, forecasts, objectives, assumptions or future events or performance are not historical facts and may be forward-looking. These statements are often, but not always, made through the use of words or
phrases such as “anticipate,” “believes,” “can,” “could,” “may,” “predicts,” “potential,” “should,” “will,” “estimate,” “plans,” “projects,” “continuing,” “ongoing,” “expects,” “intends” and similar words or phrases. Forward-looking
statements include, but are not limited to: (i) projections and estimates of revenues, expenses, income or loss, earnings or loss per share, and other financial items, including our estimated financial results for 2020, (ii) statements of
plans, objectives and expectations of South Plains or its management, (iii) statements of future economic performance, and (iv) statements of assumptions underlying such statements. Forward-looking statements should not be relied on because
they involve known and unknown risks, uncertainties and other factors, some of which are beyond the control of South Plains and City Bank. These risks, uncertainties and other factors may cause the actual results, performance, and
achievements of South Plains and City Bank to be materially different from the anticipated future results, performance or achievements expressed in, or implied by, the forward-looking statements. Factors that could cause such differences
include, but are not limited to, local, regional, national and international economic conditions, the extent of the impact of the COVID-19 pandemic, including the impact of actions taken by governmental and regulatory authorities in response
to such pandemic, such as the Coronavirus Aid, Relief, and Economic Security Act and subsequent related legislations, and the programs established thereunder, and City Bank’s participation in such programs, volatility of the financial
markets, changes in interest rates, regulatory considerations, competition and market expansion opportunities, changes in non-interest expenditures or in the anticipated benefits of such expenditures, the receipt of required regulatory
approvals, changes in non-performing assets and charge-offs, changes in tax laws, current or future litigation, regulatory examinations or other legal and/or regulatory actions, the impact of any tariffs, terrorist threats and attacks, acts
of war or threats thereof or other pandemics. Therefore, South Plains can give no assurance that the results contemplated in the forward-looking statements will be realized. For more information about these factors, please see South Plains’
reports filed with or furnished to the SEC, including South Plains’ most recent Annual Report on Form 10-K and Quarterly Report on Form 10-Q on file with the U.S. Securities and Exchange Commission (the “SEC”), including the sections entitled
"Risk Factors" and "Management's Discussion and Analysis of Financial Condition and Results of Operations." Further, any forward-looking statement speaks only as of the date on which it is made and South Plains undertakes no obligation to
update or revise any forward-looking statement to reflect events or circumstances after the date on which the statement is made or to reflect the occurrence of unanticipated events, except as required by law. All forward-looking statements
herein are qualified by these cautionary statement.NON-GAAP FINANCIAL MEASURESManagement believes that certain non-GAAP performance measures used in this presentation provide meaningful information about underlying trends in its business and
operations. Non-GAAP financial measures should be viewed in addition to, and not as an alternative for, SPFI’s reported results prepared in accordance with GAAP. Numbers in this presentation may not sum due to rounding. 2

A Leading West Texas Franchise 3 Financial Snapshot (As of June 30, 2020) Our Company Bank
holding company headquartered in Lubbock, Texas with $3.6 billion in total assetsOne of the largest independent banks headquartered in West TexasRecently executed a successful IPO in May 2019; now one of two publicly-traded Texas institutions
west of I-35Repeatedly recognized as an outstanding place to work, including being on American Banker’s Best Banks to Work For list six consecutive times Balance Sheet (Dollars in thousands) 2Q20 Total Assets $3,584,532 Total Loans
Held for Investment $2,331,716 Allowance for Loan Losses $40,635 Total Deposits $2,947,837 Interest-bearing Deposits $2,006,984 Noninterest-bearing Deposits $940,853 Total Stockholders’ Equity $336,534 Profitability (Dollars in
thousands) 2Q20 Net Income $5,615 Return on Average Assets 0.64% Return on Average Equity 6.81% Net Interest Margin 3.79% Efficiency Ratio 63.28% Capital Ratios 2Q20 Total Stockholders’ Equity to Total
Assets 9.39% Tangible Common Equity to Tangible Assets 8.68% Common Equity Tier 1 to Risk-Weighted Assets 10.51% Tier 1 Capital to Average Assets 9.60% Total Capital to Risk-Weighted Assets 14.36% Asset
Quality 2Q20 Nonperforming Loans to Total Loans Held for Investment 0.45% Nonperforming Assets to Total Assets 0.33% Allowance for Loan Losses to Total Loans Held for Investment 1.74% Net Charge-Offs to Average Loans Outstanding
(annualized) 0.27% Financial data as of June 30, 2020 as complied and reported by South Plains New Mexico Texas Dallas Bryan /College Station Houston Midland Odessa El Paso Lubbock Ruidoso SanAntonio Ft.
Worth Austin Albuquerque Santa Fe SPFI Branches (25)655 FTE Employees
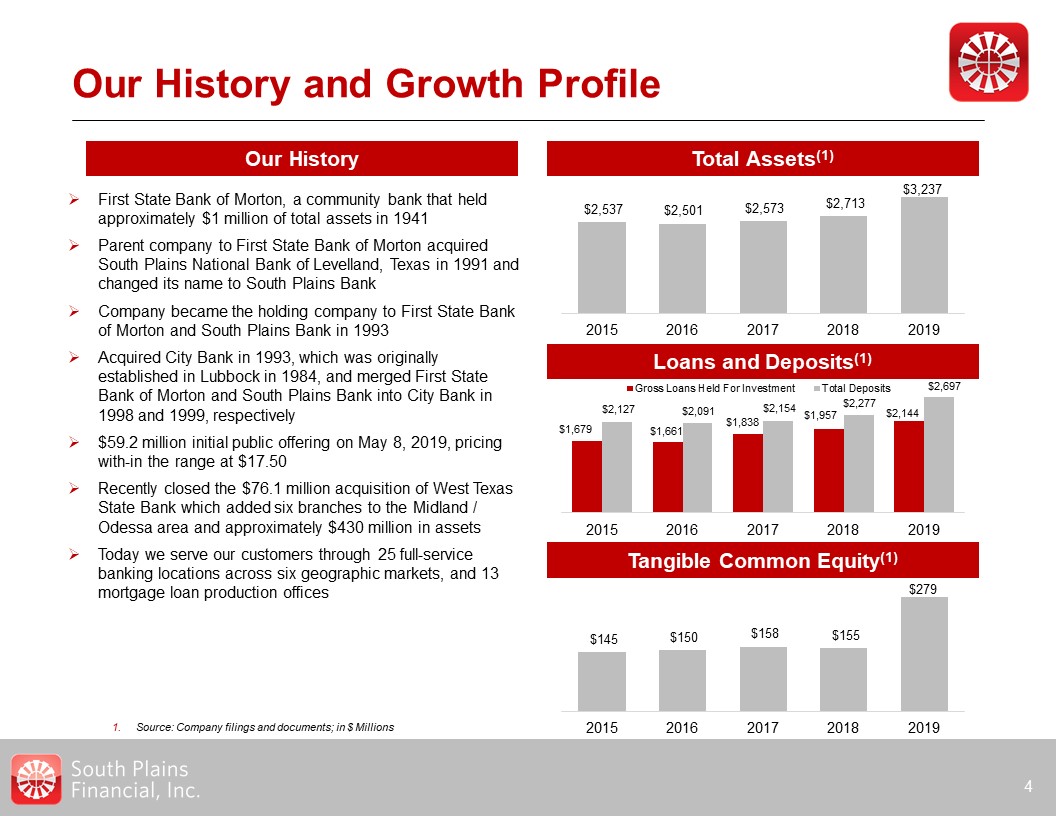
Our History and Growth Profile 4 Total Assets(1) Our History Loans and Deposits(1) Tangible
Common Equity(1) First State Bank of Morton, a community bank that held approximately $1 million of total assets in 1941Parent company to First State Bank of Morton acquired South Plains National Bank of Levelland, Texas in 1991 and changed
its name to South Plains BankCompany became the holding company to First State Bank of Morton and South Plains Bank in 1993Acquired City Bank in 1993, which was originally established in Lubbock in 1984, and merged First State Bank of Morton
and South Plains Bank into City Bank in 1998 and 1999, respectively$59.2 million initial public offering on May 8, 2019, pricing with-in the range at $17.50Recently closed the $76.1 million acquisition of West Texas State Bank which added six
branches to the Midland / Odessa area and approximately $430 million in assetsToday we serve our customers through 25 full-service banking locations across six geographic markets, and 13 mortgage loan production offices Source: Company
filings and documents; in $ Millions

Investment Highlights 5 Improving Profitability Organic Growth Strong Credit Culture Enterprise
Risk Management Experienced Management Team Emphasize Community Banking Capital Allocation to Drive Value 1 2 3 4 5 6 7

Experienced Management Team 6 Curtis C. GriffithChairman & Chief Executive Officer Elected to
the board of directors of First State Bank of Morton, Texas, in 1972 and employed by it in 1979Elected Chairman of the First State Bank of Morton board in 1984Chairman of the Board of City Bank and the Company since 1993 Steven B.
CrockettChief Financial Officer & Treasurer Began his career in public accounting in 1994 by serving for seven years with a local firm in Lubbock, TexasAppointed Chief Financial Officer in 2015Controller of the Bank and The Company for
14 and 5 years respectively Mikella D. NewsomChief Risk Officer & Secretary 24-year banking careerAppointed Chief Risk Officer of the Company in 2019Chief Risk Officer of the Bank for 5 years Appointed Secretary of the Company in
2013Previously Chief Financial Officer of the Bank Cory T. NewsomPresident Entire banking career with the Company focused on lending and operationsAppointed President and Chief Executive Officer of the Bank in 2008Joined the Board in
2008 Brent A. BatesCity Bank’s Chief Credit Officer Joined City Bank in February 2020Division Cred Officer for Simmons First National CorpEVP and Chief Credit Officer of Southwest Bancorp, Inc. 1
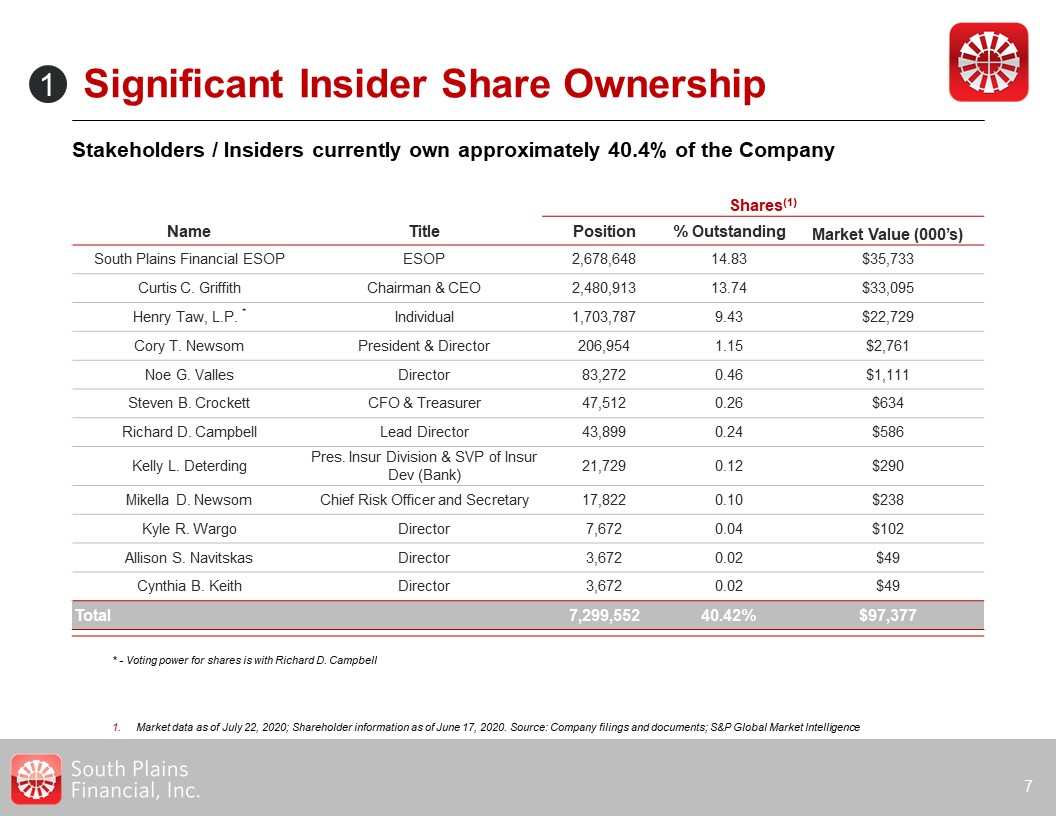
Significant Insider Share Ownership Stakeholders / Insiders currently own approximately 40.4% of the
Company 7 Shares(1) Name Title Position % Outstanding Market Value (000’s) South Plains Financial ESOP ESOP 2,678,648 14.83 $35,733 Curtis C. Griffith Chairman & CEO 2,480,913 13.74 $33,095 Henry Taw, L.P.
* Individual 1,703,787 9.43 $22,729 Cory T. Newsom President & Director 206,954 1.15 $2,761 Noe G. Valles Director 83,272 0.46 $1,111 Steven B. Crockett CFO & Treasurer 47,512 0.26 $634 Richard D. Campbell Lead
Director 43,899 0.24 $586 Kelly L. Deterding Pres. Insur Division & SVP of Insur Dev (Bank) 21,729 0.12 $290 Mikella D. Newsom Chief Risk Officer and Secretary 17,822 0.10 $238 Kyle R.
Wargo Director 7,672 0.04 $102 Allison S. Navitskas Director 3,672 0.02 $49 Cynthia B. Keith Director 3,672 0.02 $49 Total 7,299,552 40.42% $97,377 Market data as of July 22, 2020; Shareholder information as of
June 17, 2020. Source: Company filings and documents; S&P Global Market Intelligence 1 * - Voting power for shares is with Richard D. Campbell
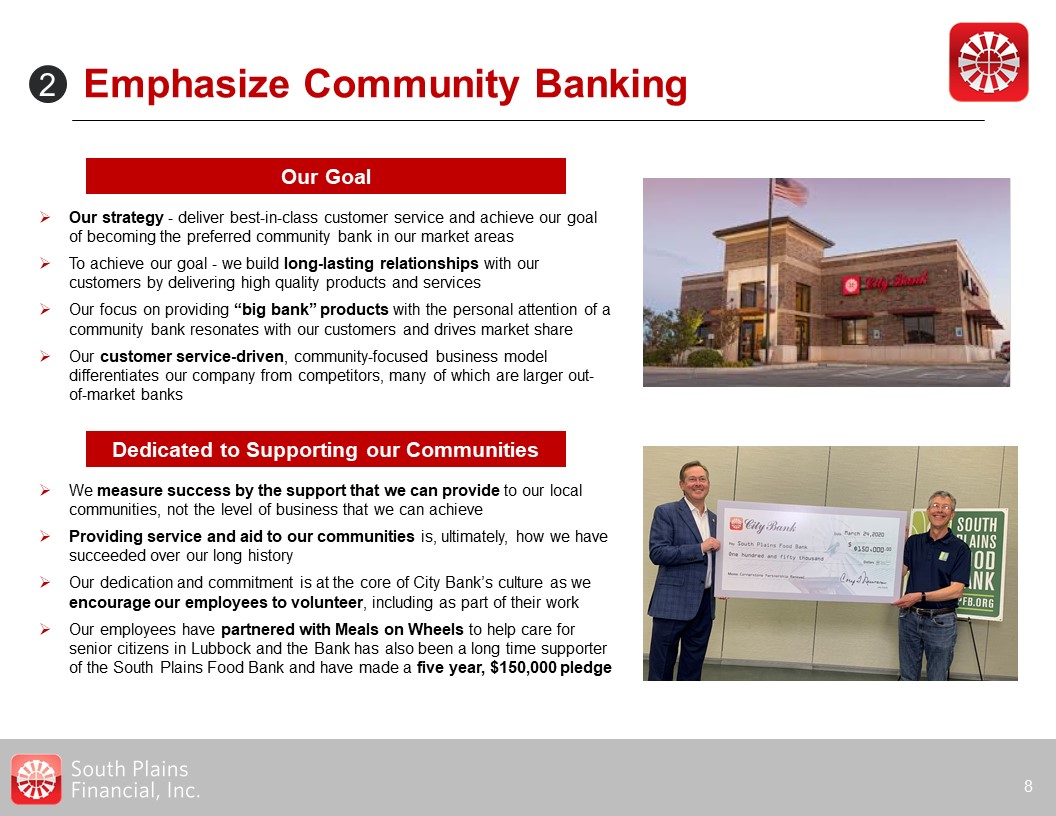
Emphasize Community Banking 8 2 Our strategy - deliver best-in-class customer service and achieve
our goal of becoming the preferred community bank in our market areasTo achieve our goal - we build long-lasting relationships with our customers by delivering high quality products and services Our focus on providing “big bank” products with
the personal attention of a community bank resonates with our customers and drives market shareOur customer service-driven, community-focused business model differentiates our company from competitors, many of which are larger out-of-market
banks Our Goal We measure success by the support that we can provide to our local communities, not the level of business that we can achieveProviding service and aid to our communities is, ultimately, how we have succeeded over our long
historyOur dedication and commitment is at the core of City Bank’s culture as we encourage our employees to volunteer, including as part of their workOur employees have partnered with Meals on Wheels to help care for senior citizens in
Lubbock and the Bank has also been a long time supporter of the South Plains Food Bank and have made a five year, $150,000 pledge Dedicated to Supporting our Communities

Our Markets of Operation 9 Market Branches(1) Deposits (millions)(1) Market
Highlights 10 $1,744 Population in excess of 315,000 with major industries in agribusiness, education, and trade among othersHome of Texas Tech University – enrollment of 39,000 students 6 $357 Area produces about 50% of the crude
oil in Texas and accounts for 20% of U.S. oil outputResponsible for the production of nearly four million barrels of crude oil per day, or roughly one third of Total U.S. oil production 3 $266 DFW is the largest MSA in Texas and fourth
largest in the nationResponsible for producing 33% of Texas GDP in 2018Home to 24 Fortune 500 Companies 2 $138 Serves as a regional economic hubLarge investments from developers over the past ten years – housing subdivisions,
condominiums, retail establishments, etc.Growing retirement community 2 $109 Population of 850,000+ with major military presence through Fort BlissAdjacent to Juarez, Mexico, which has a growing industrial center, and an estimated
population of 1.5 million peopleHome to four universities including The University of Texas at El Paso 1 $66 Home to Texas A&M University – enrollment of 69,000 studentsRanked first in Texas and third nationwide for Best Small Places
for Business and Careers in 2017 by Forbes 1 $26 Second largest MSA in Texas and fifth largest in the nationHome to 19 Fortune 500 CompaniesCalled the “Energy Capital of the World,” the area also boasts the world’s largest medical center
and second busiest port in the U.S. 2 Deposit data as of June 30, 2019 as complied and reported by S&P Global Market Intelligence. Source: FDIC; S&P Global Market Intelligence Permian Basin Dallas /Ft. Worth Ruidoso /Eastern New
Mexico El Paso Bryan /College Station Houston /The Woodlands Lubbock /South Plains

Our Markets of Operation (Cont’d) 10 Deposit Market Share: Lubbock MSA Lubbock, Texas – Our
Home Market Major industries include agriculture – primarily cotton, corn, and grain sorghum – as well as education, trade and transportation, health services and governmentHome to Texas Tech University – enrollment ranks within the top 10
for universities in Texas as of Spring 2019 at 39,000+ studentsThe Lubbock MSA reports unemployment of 2.8% for 2019Forbes listed Lubbock as one of its ‘‘Best Places for Business and Careers’’ during
2018 Headquarters In-Market Rank Institution City State Branches Deposits (Millions)(1) Market Share 1 Hilltop Holdings Dallas TX 11 $1,734 19.3% 2 South Plans
Financial Lubbock TX 9 $1,527 17.0% 3 Heartland Financial USA Dubuque IA 10 $899 10.0% 4 Wells Fargo San Francisco CA 10 $814 9.1% 5 Amarillo National Bancorp Amarillo TX 9 $791 8.8% 6 Prosperity
Bancshares Houston TX 15 $728 8.1% 7 Peoples Bancorp Lubbock TX 6 $418 4.7% 8 Bank of America Charlotte NC 2 $362 4.0% 9 Vista Bancshares Dallas TX 7 $274 3.1% 10 Happy
Bancshares Canyon TX 6 $269 3.0% 11 Americo Bancshares Wolfforth TX 5 $222 2.5% 12 Plains Bancorp Dimmitt TX 3 $167 1.9% 13 Lone Star State Bancshares Lubbock TX 1 $156 1.7% 14 First Bancshares of
Texas Midland TX 2 $138 1.5% 15 BBVA Bilbao Spain 2 $136 1.5% Top 1 - 10 Total 98 $8,633 96.2% Total For Market (25) 114 $8,977 100.0% 2 Deposit data as of June 30, 2019 as complied
and reported by S&P Global Market Intelligence. Source: BLS; FDIC; S&P Global Market Intelligence; Lubbock Chamber of Commerce; Forbes
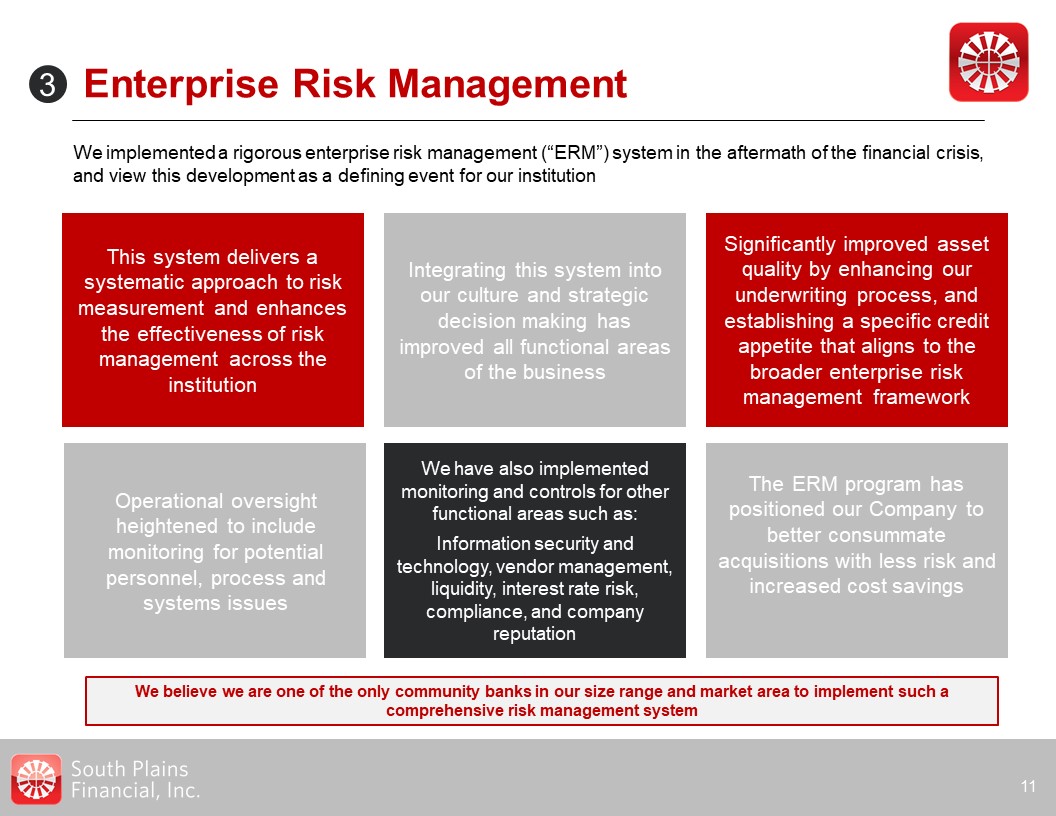
Enterprise Risk Management 11 3 We implemented a rigorous enterprise risk management (“ERM”)
system in the aftermath of the financial crisis, and view this development as a defining event for our institution This system delivers a systematic approach to risk measurement and enhances the effectiveness of risk management across the
institution Integrating this system into our culture and strategic decision making has improved all functional areas of the business Significantly improved asset quality by enhancing our underwriting process, and establishing a specific
credit appetite that aligns to the broader enterprise risk management framework Operational oversight heightened to include monitoring for potential personnel, process and systems issues We have also implemented monitoring and controls for
other functional areas such as:Information security and technology, vendor management, liquidity, interest rate risk, compliance, and company reputation The ERM program has positioned our Company to better consummate acquisitions with less
risk and increased cost savings We believe we are one of the only community banks in our size range and market area to implement such a comprehensive risk management system
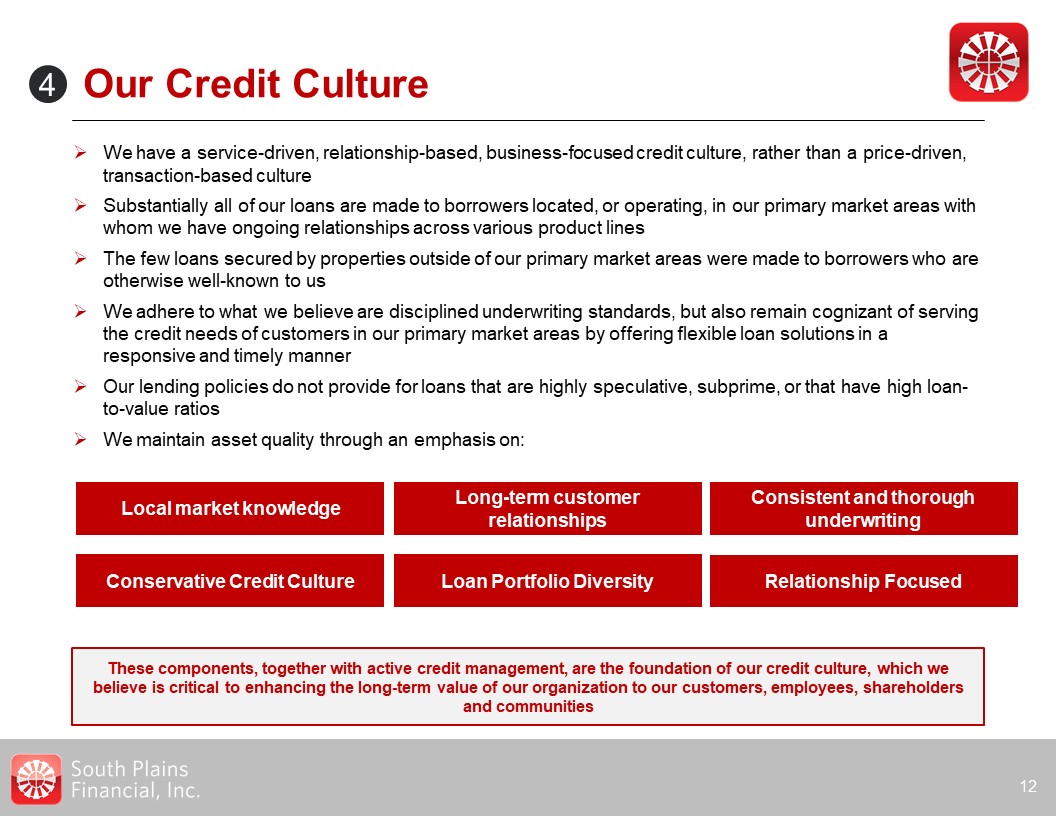
Our Credit Culture 12 We have a service-driven, relationship-based, business-focused credit
culture, rather than a price-driven, transaction-based cultureSubstantially all of our loans are made to borrowers located, or operating, in our primary market areas with whom we have ongoing relationships across various product linesThe few
loans secured by properties outside of our primary market areas were made to borrowers who are otherwise well-known to usWe adhere to what we believe are disciplined underwriting standards, but also remain cognizant of serving the credit
needs of customers in our primary market areas by offering flexible loan solutions in a responsive and timely mannerOur lending policies do not provide for loans that are highly speculative, subprime, or that have high loan-to-value ratiosWe
maintain asset quality through an emphasis on: These components, together with active credit management, are the foundation of our credit culture, which we believe is critical to enhancing the long-term value of our organization to our
customers, employees, shareholders and communities 4 Local market knowledge Long-term customer relationships Consistent and thorough underwriting Conservative Credit Culture Loan Portfolio Diversity Relationship Focused
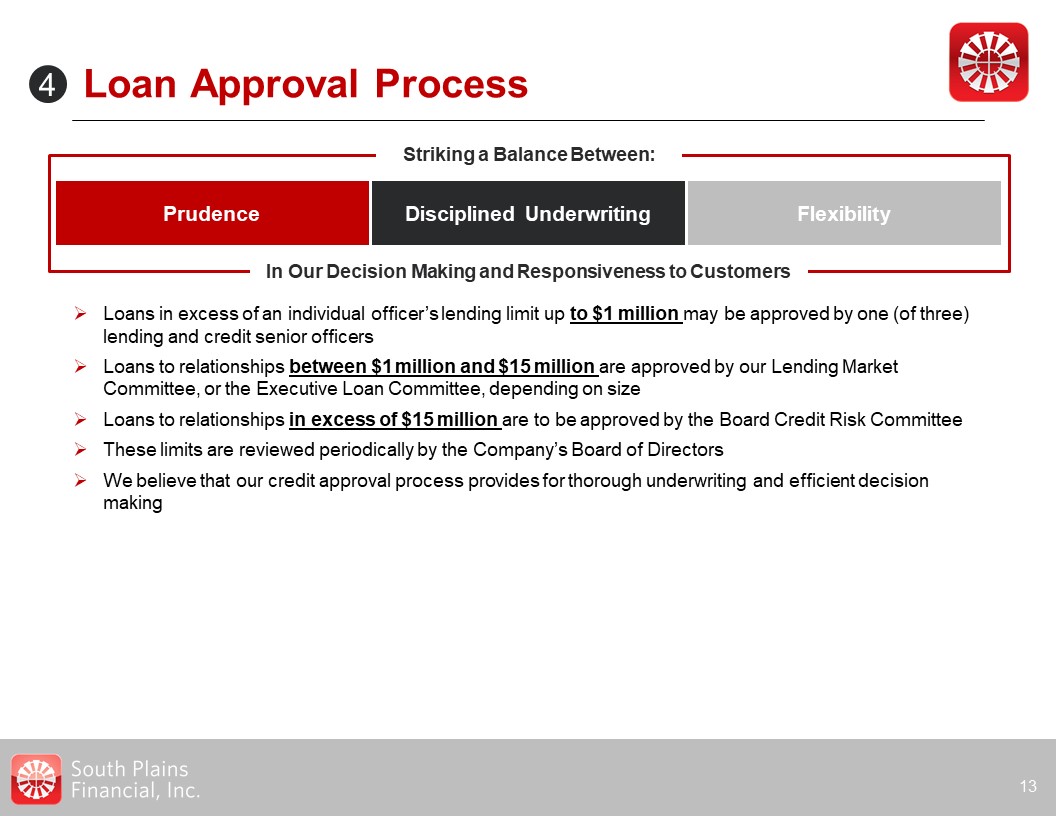
Loan Approval Process 13 Striking a Balance Between: In Our Decision Making and Responsiveness
to Customers Prudence Disciplined Underwriting Flexibility Loans in excess of an individual officer’s lending limit up to $1 million may be approved by one (of three) lending and credit senior officersLoans to relationships between $1
million and $15 million are approved by our Lending Market Committee, or the Executive Loan Committee, depending on sizeLoans to relationships in excess of $15 million are to be approved by the Board Credit Risk CommitteeThese limits are
reviewed periodically by the Company’s Board of DirectorsWe believe that our credit approval process provides for thorough underwriting and efficient decision making 4
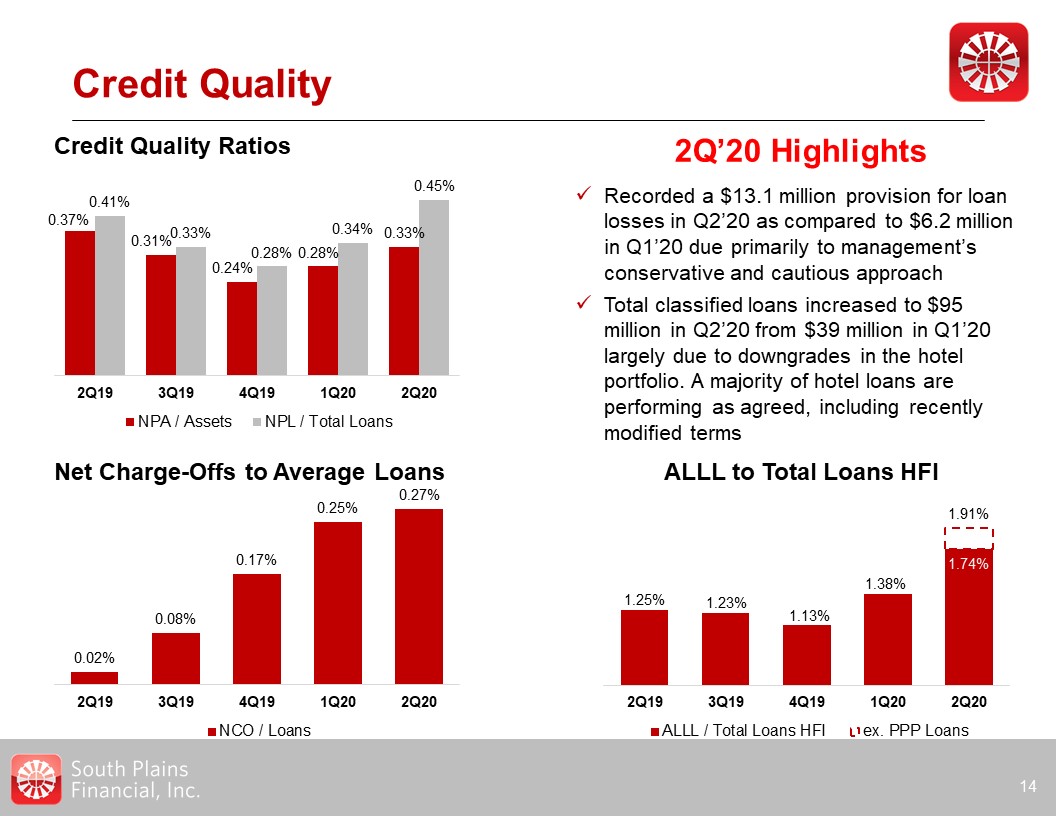
Credit Quality 14 2Q’20 Highlights Credit Quality Ratios Recorded a $13.1 million provision for
loan losses in Q2’20 as compared to $6.2 million in Q1’20 due primarily to management’s conservative and cautious approach Total classified loans increased to $95 million in Q2’20 from $39 million in Q1’20 largely due to downgrades in the
hotel portfolio. A majority of hotel loans are performing as agreed, including recently modified terms Net Charge-Offs to Average Loans ALLL to Total Loans HFI
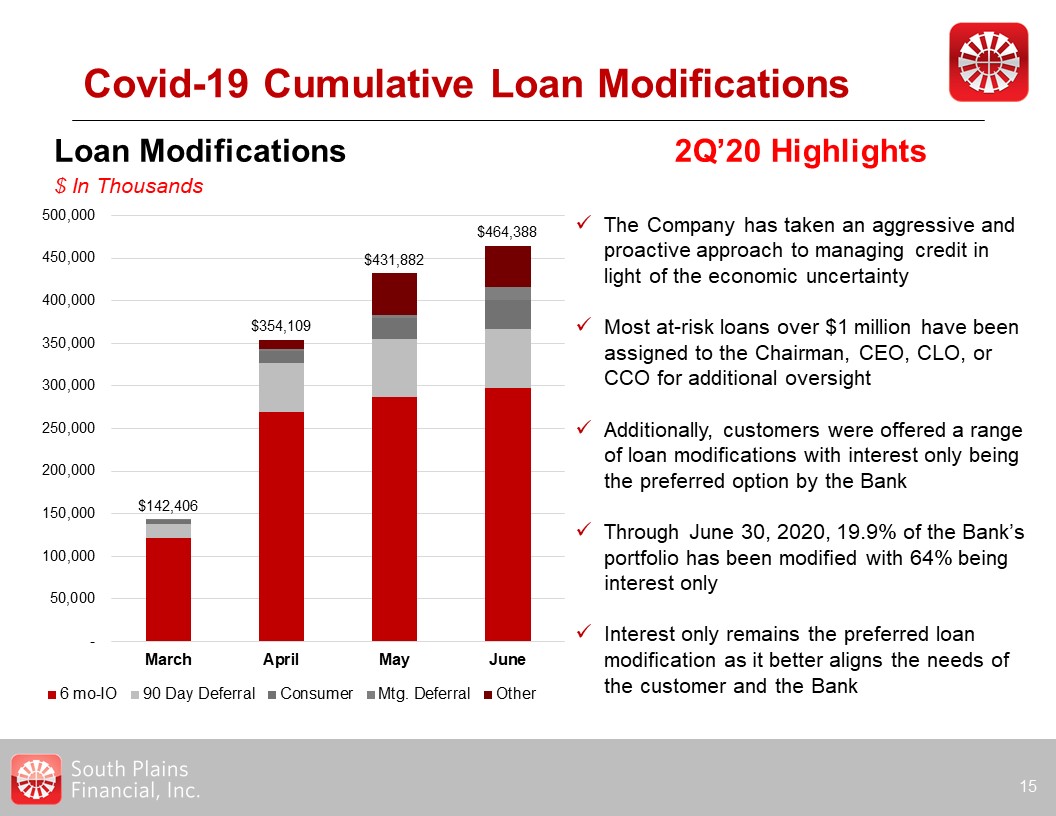
Covid-19 Cumulative Loan Modifications 15 The Company has taken an aggressive and proactive
approach to managing credit in light of the economic uncertaintyMost at-risk loans over $1 million have been assigned to the Chairman, CEO, CLO, or CCO for additional oversightAdditionally, customers were offered a range of loan modifications
with interest only being the preferred option by the BankThrough June 30, 2020, 19.9% of the Bank’s portfolio has been modified with 64% being interest onlyInterest only remains the preferred loan modification as it better aligns the needs of
the customer and the Bank 2Q’20 Highlights Loan Modifications$ In Thousands
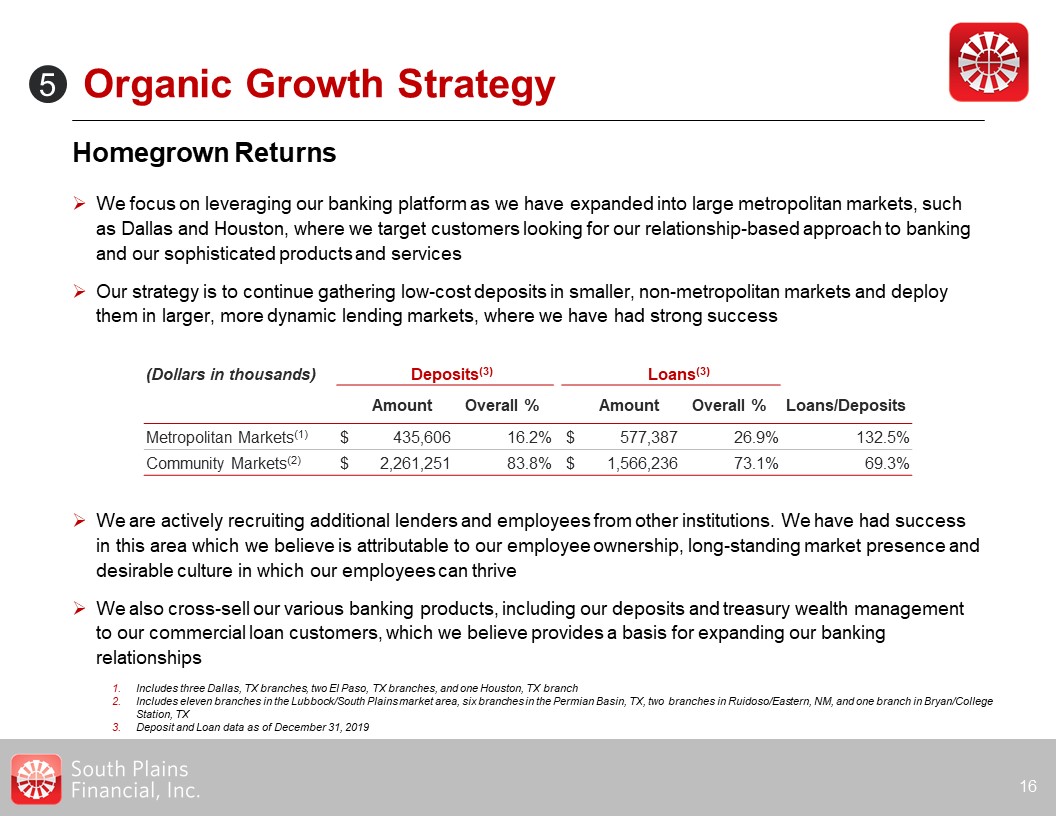
We are actively recruiting additional lenders and employees from other institutions. We have had
success in this area which we believe is attributable to our employee ownership, long-standing market presence and desirable culture in which our employees can thrive We also cross-sell our various banking products, including our deposits and
treasury wealth management to our commercial loan customers, which we believe provides a basis for expanding our banking relationships Organic Growth Strategy Homegrown Returns We focus on leveraging our banking platform as we have
expanded into large metropolitan markets, such as Dallas and Houston, where we target customers looking for our relationship-based approach to banking and our sophisticated products and services Our strategy is to continue gathering low-cost
deposits in smaller, non-metropolitan markets and deploy them in larger, more dynamic lending markets, where we have had strong success 16 Includes three Dallas, TX branches, two El Paso, TX branches, and one Houston, TX branchIncludes
eleven branches in the Lubbock/South Plains market area, six branches in the Permian Basin, TX, two branches in Ruidoso/Eastern, NM, and one branch in Bryan/College Station, TXDeposit and Loan data as of December 31, 2019 (Dollars in
thousands) Deposits(3) Loans(3) Amount Overall % Amount Overall % Loans/Deposits Metropolitan Markets(1) $ 435,606 16.2% $ 577,387 26.9% 132.5% Community
Markets(2) $ 2,261,251 83.8% $ 1,566,236 73.1% 69.3% 5
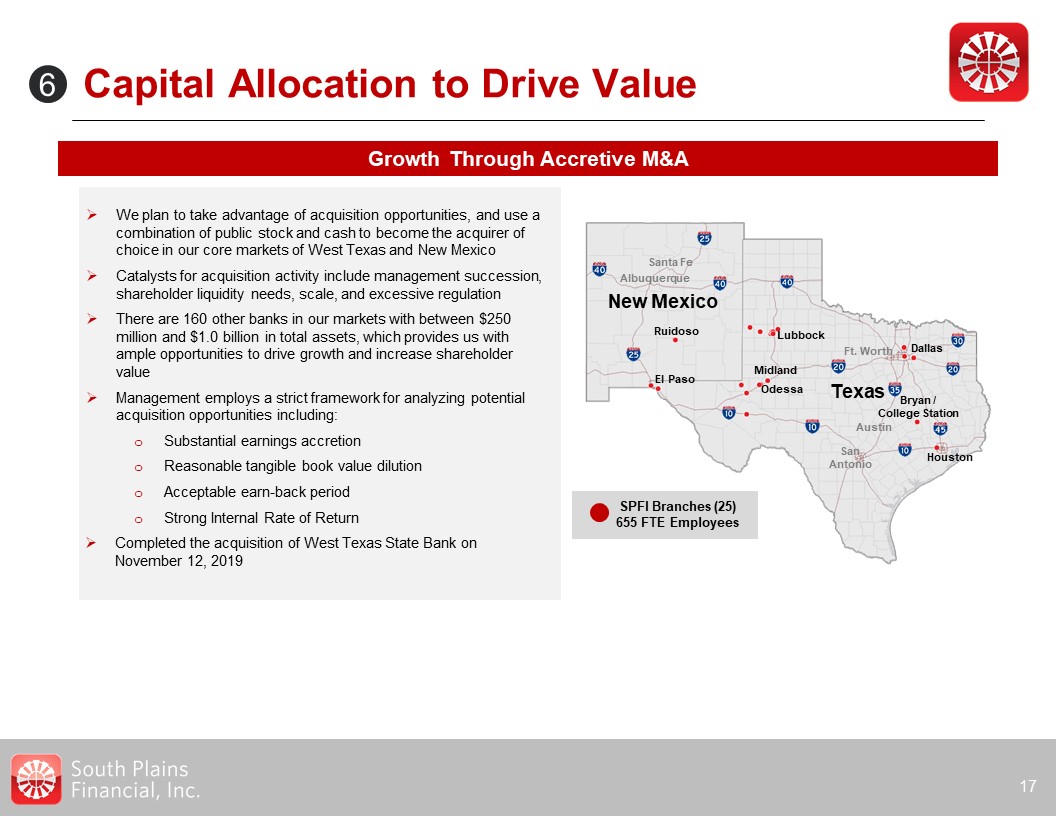
Capital Allocation to Drive Value 17 Growth Through Accretive M&A We plan to take advantage
of acquisition opportunities, and use a combination of public stock and cash to become the acquirer of choice in our core markets of West Texas and New MexicoCatalysts for acquisition activity include management succession, shareholder
liquidity needs, scale, and excessive regulationThere are 160 other banks in our markets with between $250 million and $1.0 billion in total assets, which provides us with ample opportunities to drive growth and increase shareholder
valueManagement employs a strict framework for analyzing potential acquisition opportunities including:Substantial earnings accretionReasonable tangible book value dilutionAcceptable earn-back periodStrong Internal Rate of ReturnCompleted the
acquisition of West Texas State Bank on November 12, 2019 6 New Mexico Texas Dallas Bryan /College Station Houston Midland Odessa El Paso Lubbock Ruidoso SanAntonio Ft. Worth Austin Albuquerque Santa Fe SPFI Branches
(25)655 FTE Employees

Our Acquisition Strategy 18 Strategy Guidelines Commentary 6 We plan to take advantage of
acquisition opportunities, and use a combination of public stock and cash to become the acquirer of choice in West TexasCatalysts for acquisition activity include:Management successionShareholder liquidity needsScale, and Excessive regulation
We believe we have ample opportunities to make acquisitions that increase shareholder value:There are 25 banks located in the West Texas market area with total assets between $250 million and $2.0
billion Metric Promised? Delivered? Contiguous West Texas Market Manageable Size Attractively Priced Substantial EPS Accretion TBV Earnback < 4 Years TBV Dilution Under 10% Strong IRR We
Deliver on our Promises to Execute Thoughtful M&A, as Seen in our Most Recent Transaction Source: S&P Global Market Intelligence
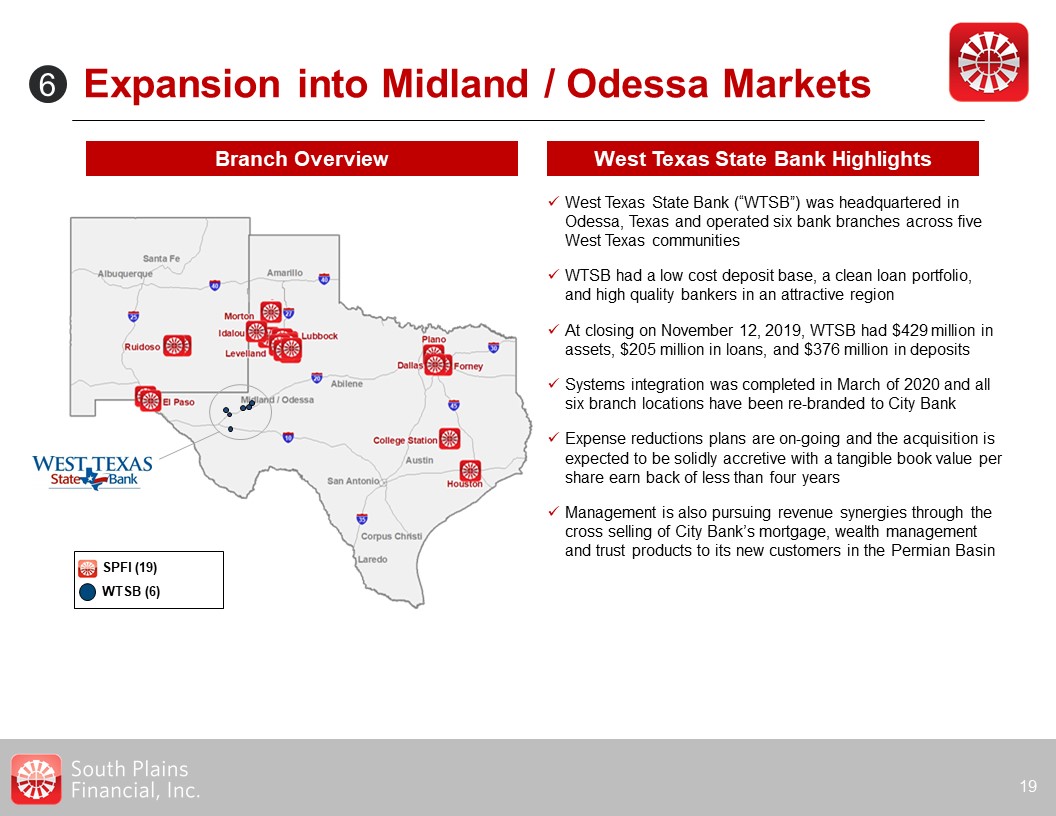
Expansion into Midland / Odessa Markets 19 West Texas State Bank Highlights Branch Overview West
Texas State Bank (“WTSB”) was headquartered in Odessa, Texas and operated six bank branches across five West Texas communitiesWTSB had a low cost deposit base, a clean loan portfolio, and high quality bankers in an attractive region At
closing on November 12, 2019, WTSB had $429 million in assets, $205 million in loans, and $376 million in depositsSystems integration was completed in March of 2020 and all six branch locations have been re-branded to City BankExpense
reductions plans are on-going and the acquisition is expected to be solidly accretive with a tangible book value per share earn back of less than four yearsManagement is also pursuing revenue synergies through the cross selling of City Bank’s
mortgage, wealth management and trust products to its new customers in the Permian Basin SPFI (19)WTSB (6) 6

Priority Expansion Markets – West Texas 20 Dallas Bryan /College
Station Houston Midland Odessa El Paso Lubbock SanAntonio Ft. Worth Austin Midland /Odessa El Paso Located along Permian Basin, which is a petroleum rich area that extends into the South Plains region of Lubbock and west into the
southeastern portion of New MexicoThe Permian Basin has been called the “Heart of American Oil Country” and is responsible for the production of nearly four million barrels of crude oil per day, or roughly one third of total U.S. oil
productionLed the nation in job growth, with employment surging by nearly 12% during 2018More than 200 drilling rigs, contributing to a material portion of operating rigs in the U.S.Analysts predict the region’s output will expand over time
due to cost-reducing advances in hydraulic fracturing Adjacent to Juarez, Mexico, which has a growing industrial center and an estimated population of 1.5 million people, and has contributed to significant growth in the El Paso MSACivil
employers include a number of universities, including The University of Texas at El Paso, The Texas Tech School of Medicine, El Paso Community College, and Vista CollegeHome to Fort Bliss, which houses the 1st Armored Division, the 32nd Army
Air and Missile Defense Command and the 402nd Field Artillery Brigade, among other major units 6
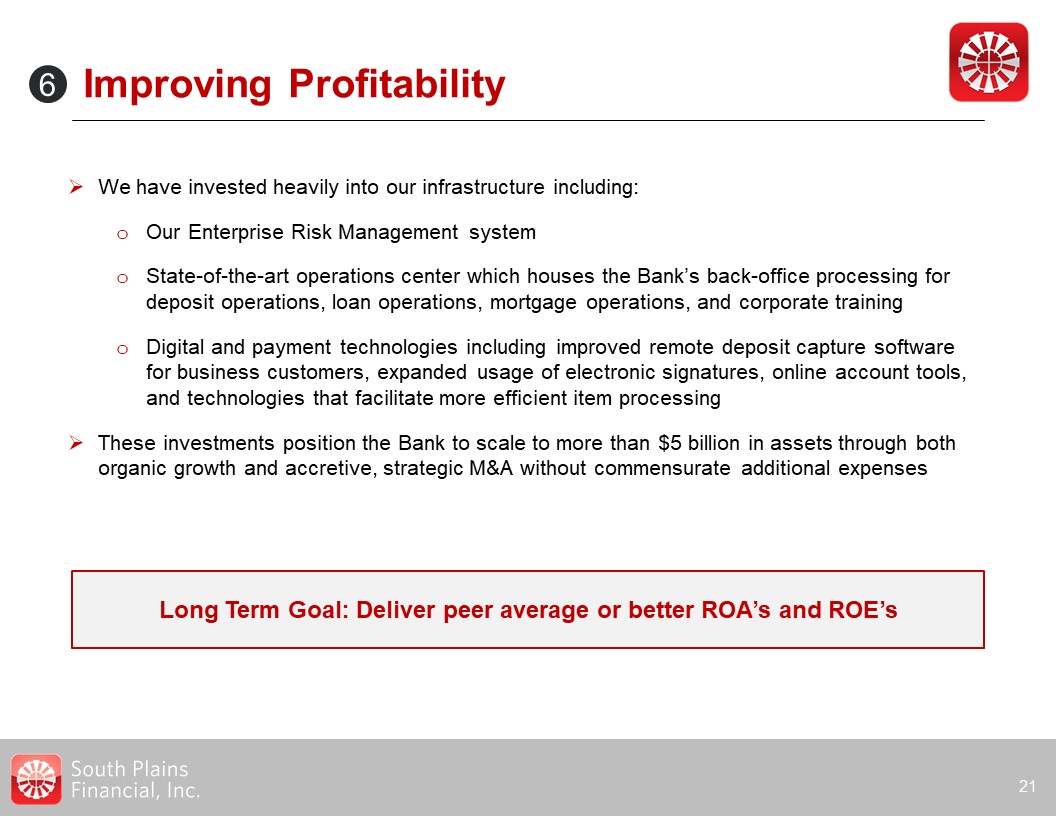
Improving Profitability 21 We have invested heavily into our infrastructure including:Our
Enterprise Risk Management system State-of-the-art operations center which houses the Bank’s back-office processing for deposit operations, loan operations, mortgage operations, and corporate trainingDigital and payment technologies including
improved remote deposit capture software for business customers, expanded usage of electronic signatures, online account tools, and technologies that facilitate more efficient item processing These investments position the Bank to scale to
more than $5 billion in assets through both organic growth and accretive, strategic M&A without commensurate additional expenses Long Term Goal: Deliver peer average or better ROA’s and ROE’s 6
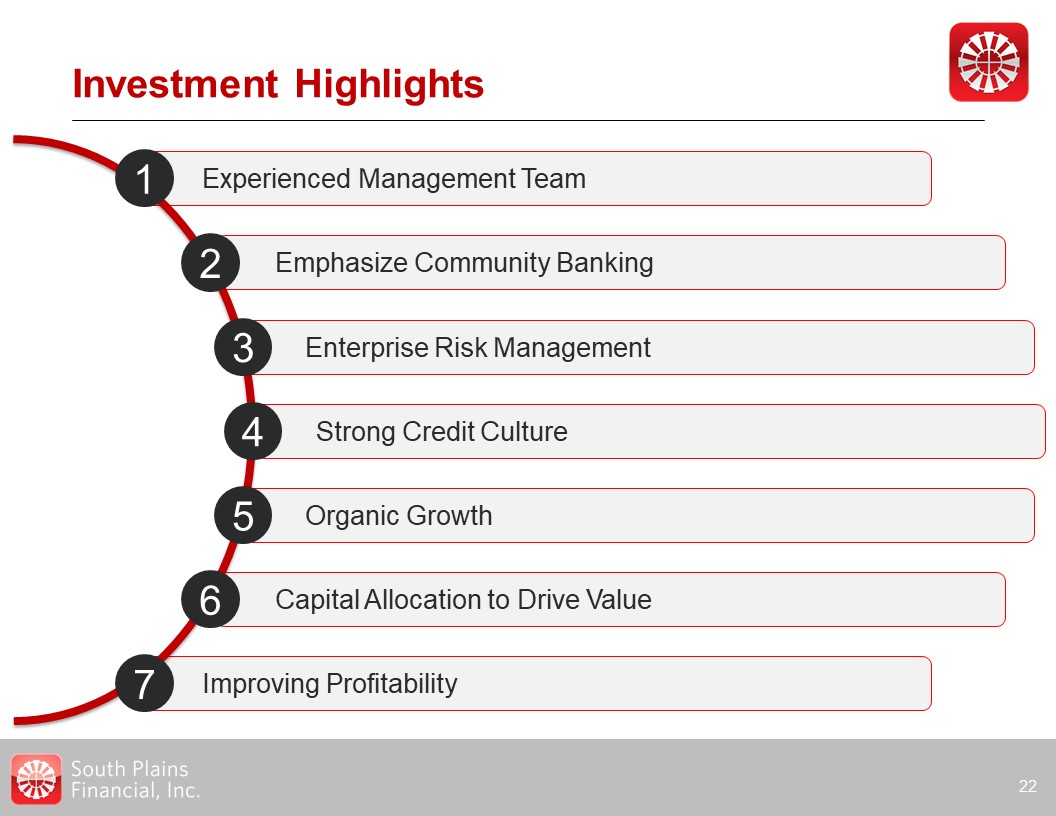
Investment Highlights 22 Improving Profitability Organic Growth Strong Credit Culture Enterprise
Risk Management Experienced Management Team Emphasize Community Banking Capital Allocation to Drive Value 1 2 3 4 5 6 7

Financial Update 23
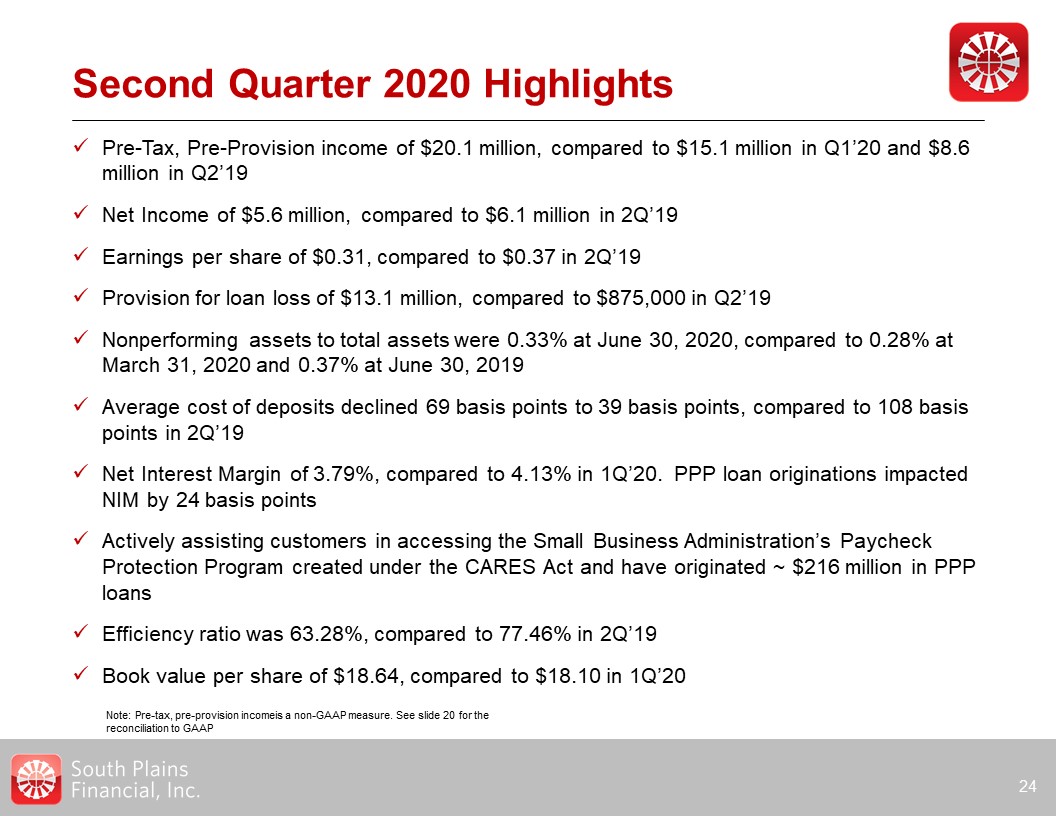
Second Quarter 2020 Highlights 24 Pre-Tax, Pre-Provision income of $20.1 million, compared to $15.1
million in Q1’20 and $8.6 million in Q2’19Net Income of $5.6 million, compared to $6.1 million in 2Q’19Earnings per share of $0.31, compared to $0.37 in 2Q’19Provision for loan loss of $13.1 million, compared to $875,000 in Q2’19Nonperforming
assets to total assets were 0.33% at June 30, 2020, compared to 0.28% at March 31, 2020 and 0.37% at June 30, 2019Average cost of deposits declined 69 basis points to 39 basis points, compared to 108 basis points in 2Q’19Net Interest Margin
of 3.79%, compared to 4.13% in 1Q’20. PPP loan originations impacted NIM by 24 basis pointsActively assisting customers in accessing the Small Business Administration’s Paycheck Protection Program created under the CARES Act and have
originated ~ $216 million in PPP loansEfficiency ratio was 63.28%, compared to 77.46% in 2Q’19Book value per share of $18.64, compared to $18.10 in 1Q’20 Note: Pre-tax, pre-provision incomeis a non-GAAP measure. See slide 20 for the
reconciliation to GAAP
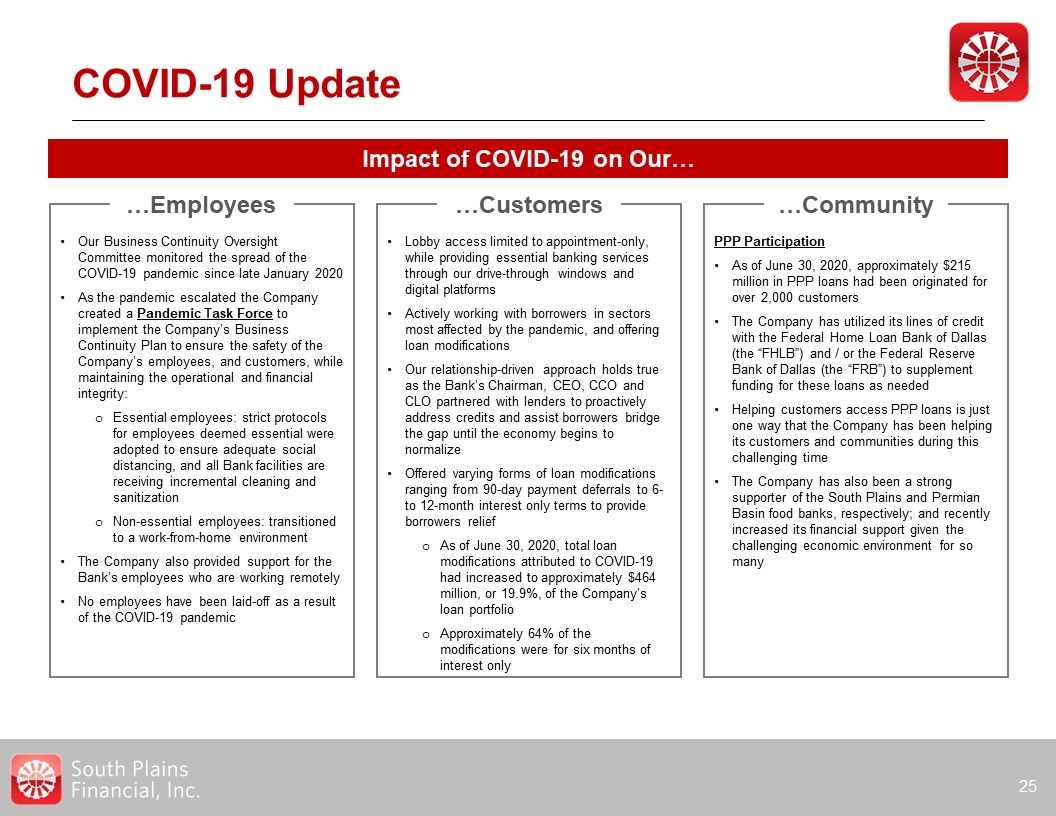
COVID-19 Update 25 Impact of COVID-19 on Our… Our Business Continuity Oversight Committee
monitored the spread of the COVID-19 pandemic since late January 2020As the pandemic escalated the Company created a Pandemic Task Force to implement the Company’s Business Continuity Plan to ensure the safety of the Company’s employees, and
customers, while maintaining the operational and financial integrity:Essential employees: strict protocols for employees deemed essential were adopted to ensure adequate social distancing, and all Bank facilities are receiving incremental
cleaning and sanitizationNon-essential employees: transitioned to a work-from-home environmentThe Company also provided support for the Bank’s employees who are working remotelyNo employees have been laid-off as a result of the COVID-19
pandemic Lobby access limited to appointment-only, while providing essential banking services through our drive-through windows and digital platformsActively working with borrowers in sectors most affected by the pandemic, and offering loan
modificationsOur relationship-driven approach holds true as the Bank’s Chairman, CEO, CCO and CLO partnered with lenders to proactively address credits and assist borrowers bridge the gap until the economy begins to normalizeOffered varying
forms of loan modifications ranging from 90-day payment deferrals to 6- to 12-month interest only terms to provide borrowers reliefAs of June 30, 2020, total loan modifications attributed to COVID-19 had increased to approximately $464
million, or 19.9%, of the Company’s loan portfolioApproximately 64% of the modifications were for six months of interest only PPP ParticipationAs of June 30, 2020, approximately $215 million in PPP loans had been originated for over 2,000
customersThe Company has utilized its lines of credit with the Federal Home Loan Bank of Dallas (the “FHLB”) and / or the Federal Reserve Bank of Dallas (the “FRB”) to supplement funding for these loans as neededHelping customers access PPP
loans is just one way that the Company has been helping its customers and communities during this challenging timeThe Company has also been a strong supporter of the South Plains and Permian Basin food banks, respectively; and recently
increased its financial support given the challenging economic environment for so many …Employees …Customers …Community
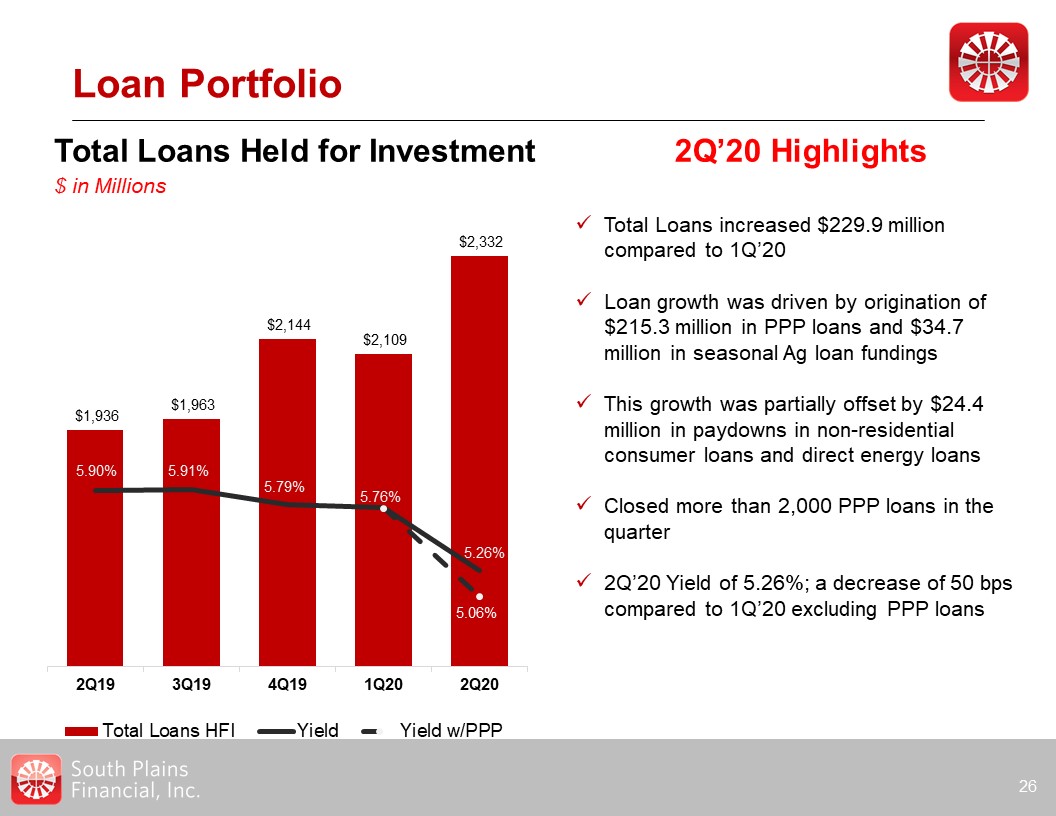
Loan Portfolio 26 Total Loans increased $229.9 million compared to 1Q’20Loan growth was driven by
origination of $215.3 million in PPP loans and $34.7 million in seasonal Ag loan fundings This growth was partially offset by $24.4 million in paydowns in non-residential consumer loans and direct energy loansClosed more than 2,000 PPP loans
in the quarter2Q’20 Yield of 5.26%; a decrease of 50 bps compared to 1Q’20 excluding PPP loans 2Q’20 Highlights Total Loans Held for Investment$ in Millions
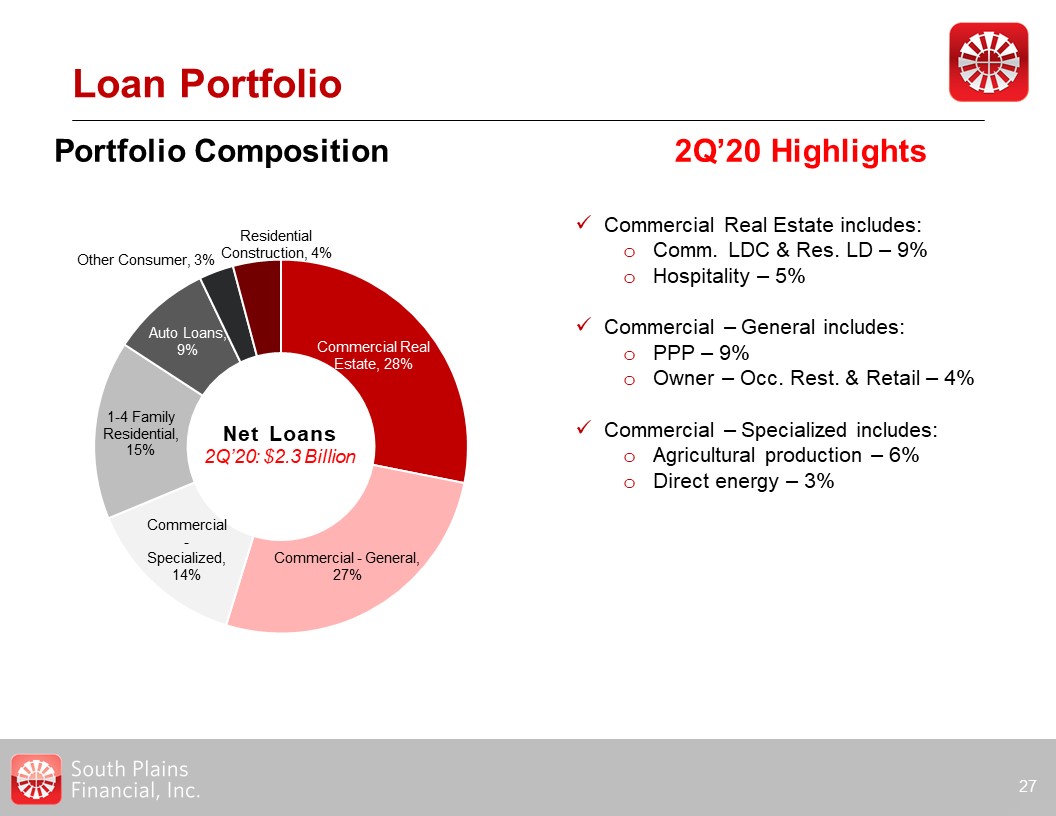
Loan Portfolio 27 Commercial Real Estate includes:Comm. LDC & Res. LD – 9%Hospitality –
5%Commercial – General includes:PPP – 9%Owner – Occ. Rest. & Retail – 4%Commercial – Specialized includes:Agricultural production – 6%Direct energy – 3% 2Q’20 Highlights Portfolio Composition Net Loans2Q’20: $2.3 Billion

Hospitality Select Loan Industry Concentration Detail 28 As of June 30,
2020 DirectEnergy Total loans of $79 million91% support services, 9% upstreamNearly 100% Permian and Palo Duro Basins20% of energy sector classifiedZero non-accrual creditsALLL on energy sector is 5.7% Total loans of $115 million on
operating hospitality*$26 million in hotels under constructionUnfunded commitments are $24 million78% of balances are to limited service hotelsALLL on operating hospitality is 6.8%** Does not include loans reported in construction and
development Energy Support Services by Type Hospitality by Geography
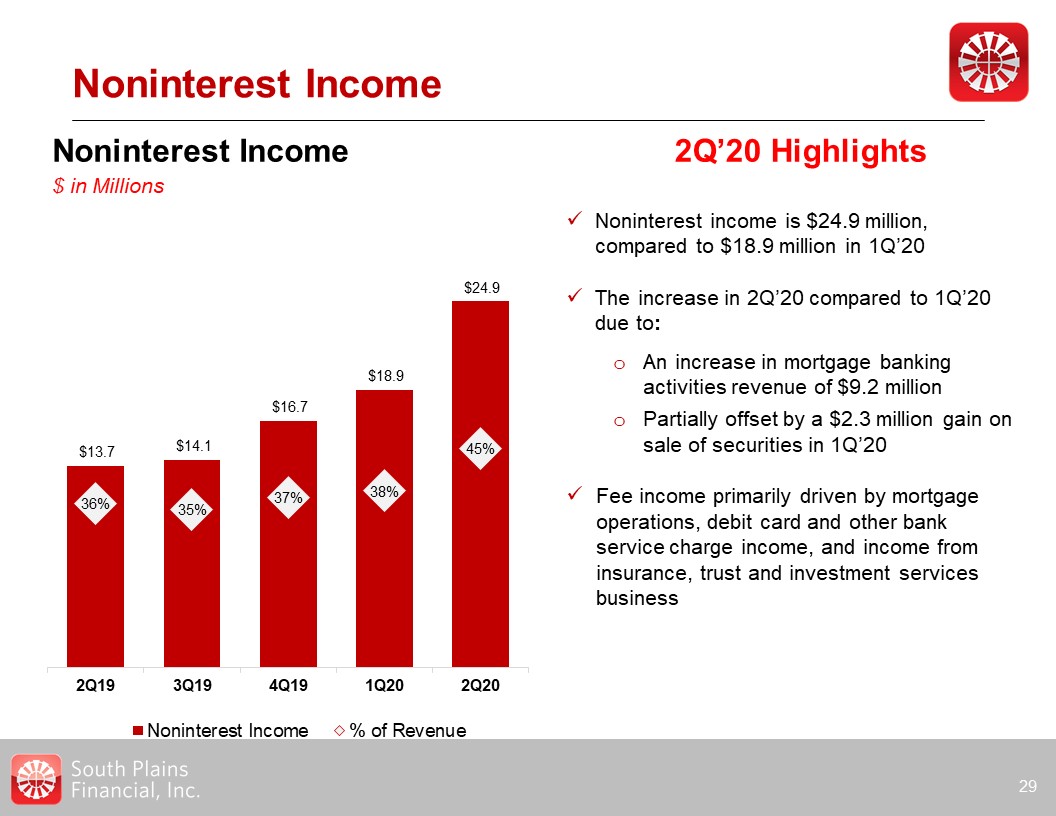
Noninterest Income 29 Noninterest Income$ in Millions 2Q’20 Highlights Noninterest income is
$24.9 million, compared to $18.9 million in 1Q’20The increase in 2Q’20 compared to 1Q’20 due to:An increase in mortgage banking activities revenue of $9.2 millionPartially offset by a $2.3 million gain on sale of securities in 1Q’20Fee income
primarily driven by mortgage operations, debit card and other bank service charge income, and income from insurance, trust and investment services business
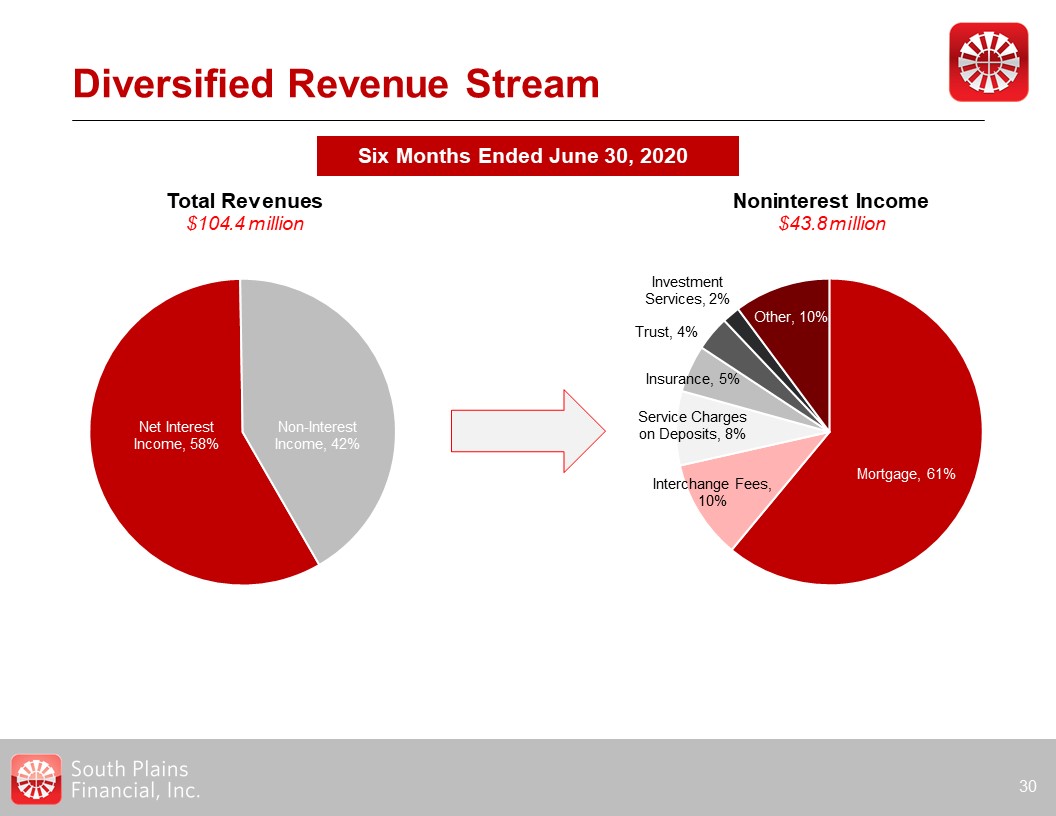
Diversified Revenue Stream Six Months Ended June 30, 2020 30 Total Revenues$104.4
million Noninterest Income$43.8 million

Net Interest Income and Margin 31 Net Interest Income & Margin$ in Millions 2Q’20
Highlights Net interest income of $30.4 million, compared to $24.8 million in 2Q’19The increase as compared to 2Q’19 was a result of:A $429 million rise in average loans primarily from the WTSB acquisition and PPP loans This was partially
offset by a decrease in overall rates in 1Q’202Q’20 NIM of 3.79%; a decrease of 34bps and 9bps, compared to 1Q’20 and 2Q’19, respectivelyPPP loan origination reduced the 2Q’20 NIM by 11bps as compared to 1Q’20
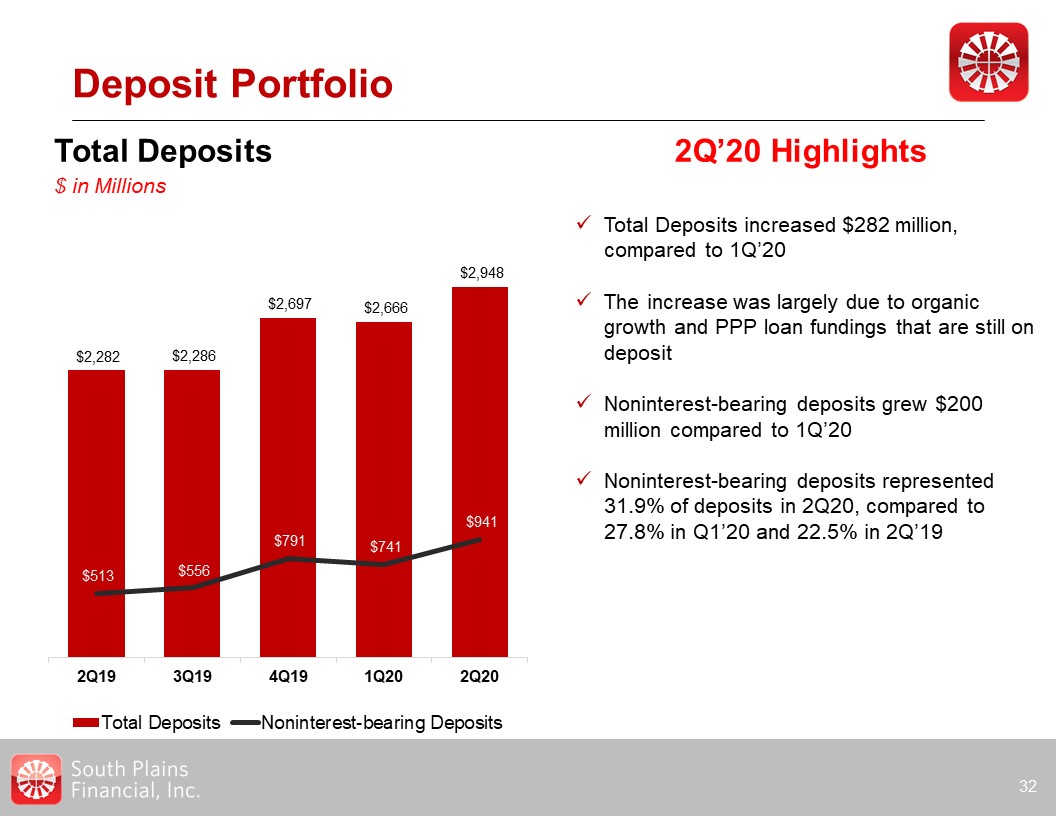
Deposit Portfolio 32 Total Deposits$ in Millions 2Q’20 Highlights Total Deposits increased $282
million, compared to 1Q’20The increase was largely due to organic growth and PPP loan fundings that are still on depositNoninterest-bearing deposits grew $200 million compared to 1Q’20 Noninterest-bearing deposits represented 31.9% of
deposits in 2Q20, compared to 27.8% in Q1’20 and 22.5% in 2Q’19
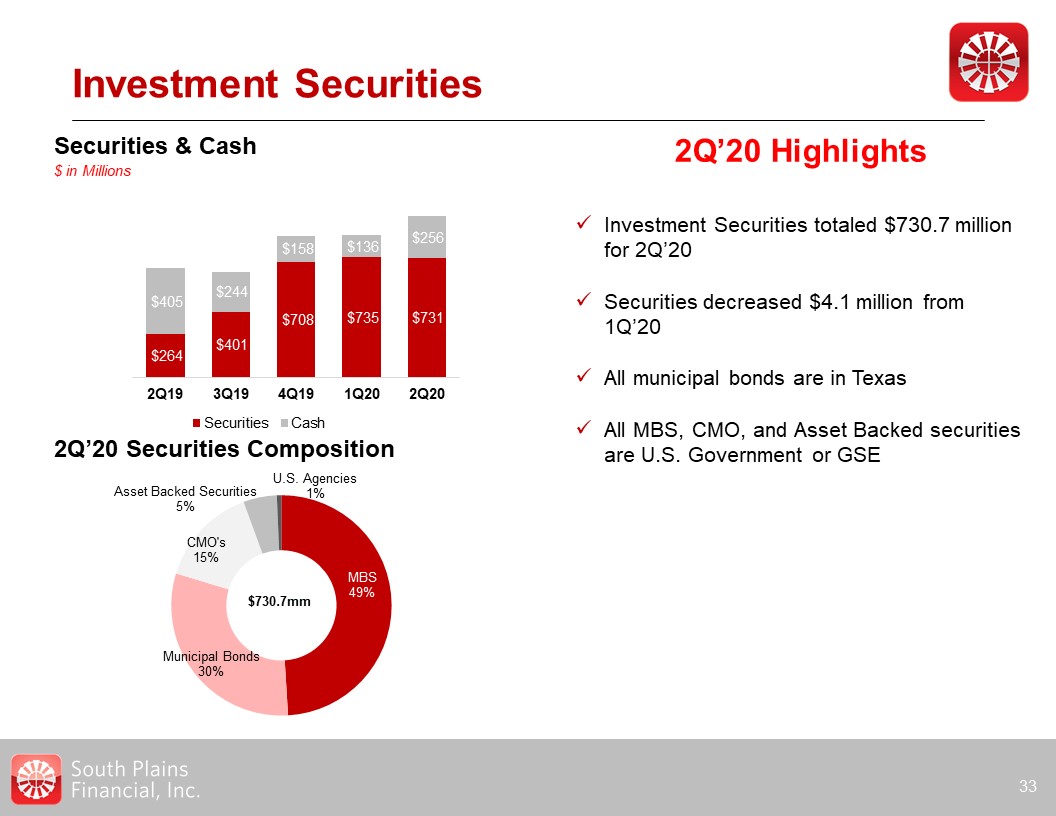
Investment Securities 33 2Q’20 Highlights Investment Securities totaled $730.7 million for
2Q’20Securities decreased $4.1 million from 1Q’20All municipal bonds are in TexasAll MBS, CMO, and Asset Backed securities are U.S. Government or GSE 2Q’20 Securities Composition $730.7mm Securities & Cash$ in Millions
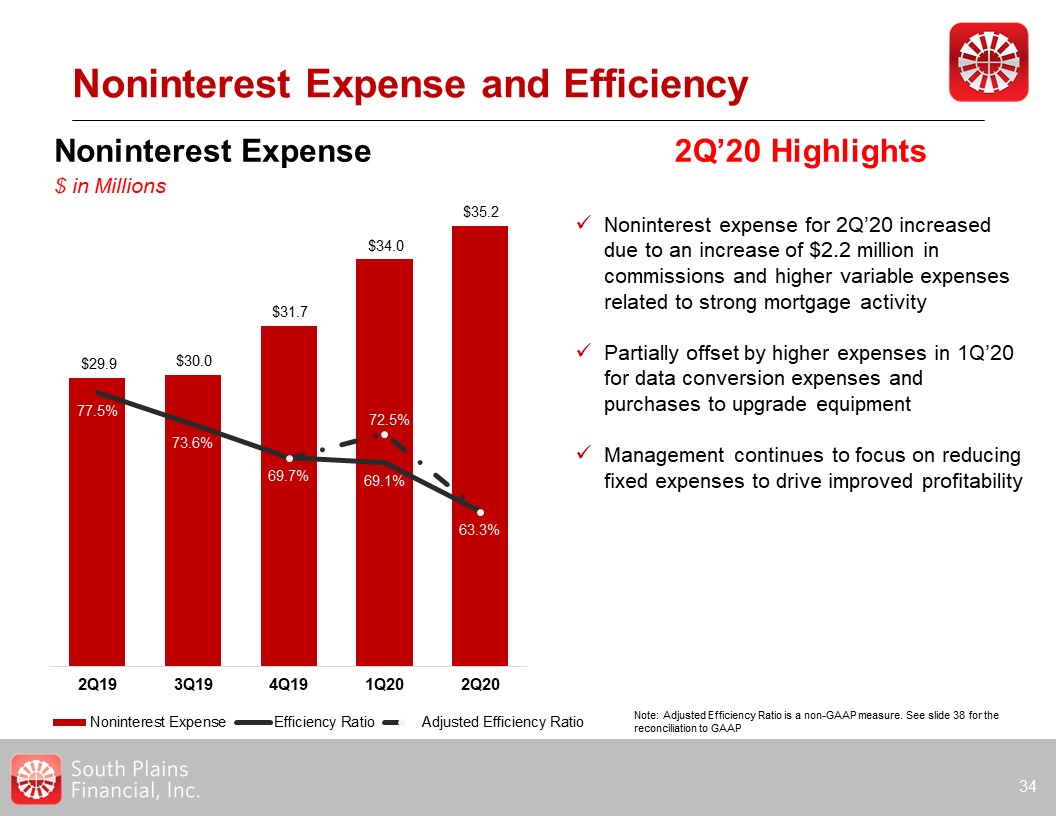
Noninterest Expense and Efficiency 34 Noninterest Expense$ in Millions 2Q’20 Highlights Noninterest
expense for 2Q’20 increased due to an increase of $2.2 million in commissions and higher variable expenses related to strong mortgage activityPartially offset by higher expenses in 1Q’20 for data conversion expenses and purchases to upgrade
equipment Management continues to focus on reducing fixed expenses to drive improved profitability Note: Adjusted Efficiency Ratio is a non-GAAP measure. See slide 38 for the reconciliation to GAAP

Balance Sheet Growth and Development 35 2Q’20 Highlights Balance Sheet Highlights$ in
Millions Total Deposits were $2.9 billion as of 2Q’20, compared to $2.3 billion in 2Q’19:$343 million from the assumption of deposits in the WTSB acquisitionOrganic growth and PPP loan fundings still on depositTotal Loans HFI were $2.3
billion as of 2Q’20, compared to $1.9 billion in 2Q’19$215 million of the increase was the result of PPP originations and $180 million net increase from the WTSB acquisitionTangible Book Value Per Share of $17.06 for the period ended June 30,
2020 Tangible Book Value Per Share Note: Adjusted Efficiency Ratio is a non-GAAP measure. See slide 39 for the reconciliation to GAAP

Strong Capital Base 36 Total Stockholders’ Equity to Total Assets Ratio Common Equity Tier 1
Ratio Tier 1 Capital to Average Assets Ratio Total Capital to Risk-Weighted Assets Ratio

Appendix 37
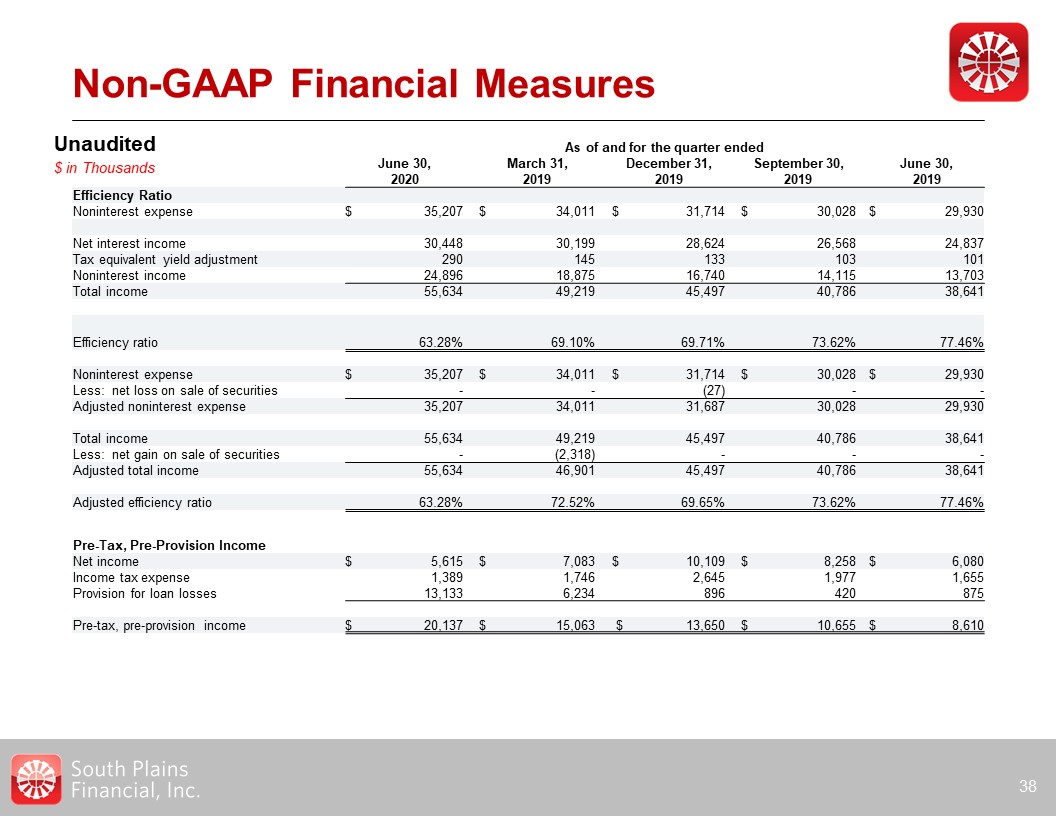
Non-GAAP Financial Measures 38 As of and for the quarter ended June
30,2020 March 31,2019 December 31,2019 September 30,2019 June 30,2019 Efficiency Ratio Noninterest expense $ 35,207 $ 34,011 $ 31,714 $ 30,028
$ 29,930 Net interest income 30,448 30,199 28,624 26,568 24,837 Tax equivalent yield adjustment 290 145 133 103 101 Noninterest
income 24,896 18,875 16,740 14,115 13,703 Total income 55,634 49,219 45,497 40,786 38,641 Efficiency ratio 63.28%
69.10% 69.71% 73.62% 77.46% Noninterest expense $ 35,207 $ 34,011 $ 31,714 $ 30,028 $ 29,930 Less: net loss on sale of securities - -
(27) - - Adjusted noninterest expense 35,207 34,011 31,687 30,028 29,930 Total income 55,634 49,219 45,497 40,786
38,641 Less: net gain on sale of securities - (2,318) - - - Adjusted total income 55,634 46,901 45,497 40,786 38,641 Adjusted
efficiency ratio 63.28% 72.52% 69.65% 73.62% 77.46% Unaudited$ in Thousands Pre-Tax, Pre-Provision Income Net income $ 5,615 $ 7,083 $ 10,109
$ 8,258 $ 6,080 Income tax expense 1,389 1,746 2,645 1,977 1,655 Provision for loan losses 13,133 6,234 896 420 875
Pre-tax, pre-provision income $ 20,137 $ 15,063 $ 13,650 $ 10,655 $ 8,610
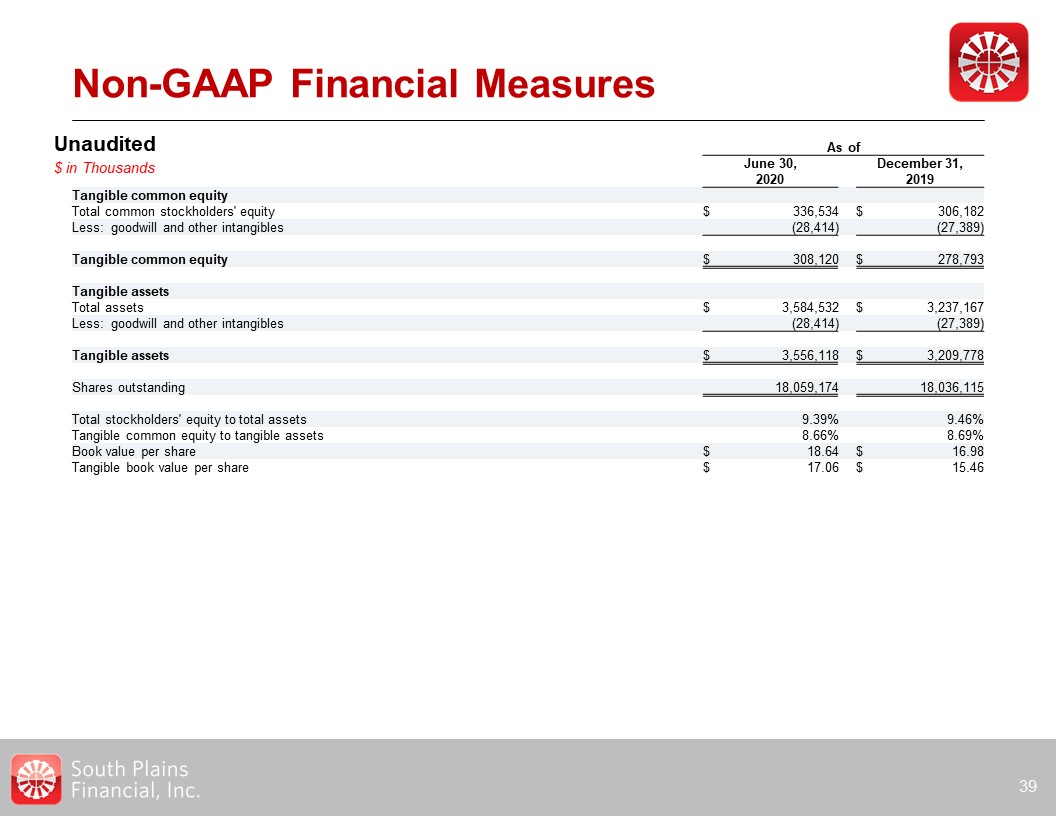
Non-GAAP Financial Measures 39 As of June 30,2020 December 31,2019 Tangible
common equity Total common stockholders' equity $ 336,534 $ 306,182 Less: goodwill and other intangibles (28,414) (27,389) Tangible common equity $ 308,120 $ 278,793
Tangible assets Total assets $ 3,584,532 $ 3,237,167 Less: goodwill and other intangibles (28,414) (27,389) Tangible assets $ 3,556,118 $ 3,209,778 Shares
outstanding 18,059,174 18,036,115 Total stockholders' equity to total assets 9.39% 9.46% Tangible common equity to tangible assets 8.66% 8.69% Book value per share $ 18.64
$ 16.98 Tangible book value per share $ 17.06 $ 15.46 Unaudited$ in Thousands